1.4.1 Photosynthesisers as biomass producers
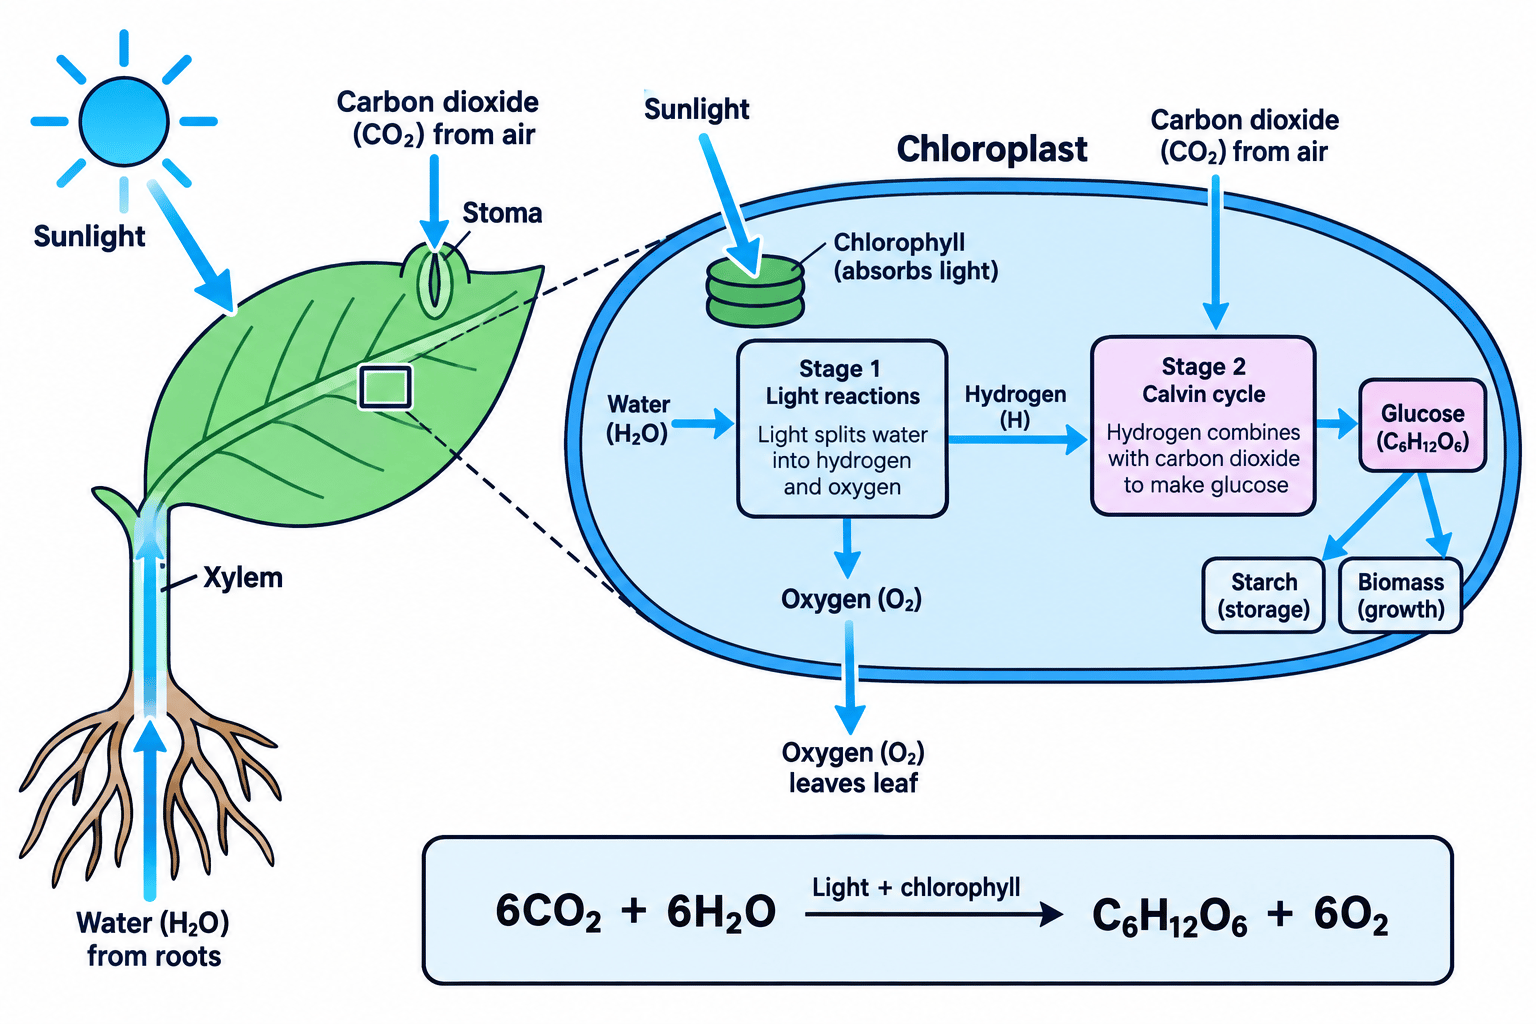
Where photosynthesis happens
Photosynthesis
The endothermic process in which light energy absorbed by chlorophyll in the chloroplasts is used to make glucose from carbon dioxide and water, releasing oxygen.
Chloroplast
The organelle in plant and algal cells that contains chlorophyll and is the site of photosynthesis.
Chlorophyll
The green pigment held inside chloroplasts that absorbs the light energy used in photosynthesis.
- Photosynthesis is the process in which light energy is used to build glucose from carbon dioxide and water, with oxygen released as a by-product.
- It is carried out by plants, by algae and by some bacteria, and it is the only process on Earth that brings a large amount of new chemical energy into living things.
- In a plant it takes place inside the chloroplasts, so only cells that contain chloroplasts can photosynthesise.
- Chloroplasts are most tightly packed into the palisade mesophyll cells just below the upper surface of a leaf, where the most light arrives.
- Inside each chloroplast the green pigment chlorophyll is spread over stacks of flattened membranes, which spreads it out so that as much light as possible is absorbed.
- Chlorophyll absorbs light most strongly at the red and blue ends of the visible spectrum.
- It reflects green light rather than absorbing it, and that reflected light is what reaches your eye, which is why leaves look green.
- Chlorophyll is a pigment and not an enzyme, so its job is to absorb light energy rather than to speed a reaction up.
- A cell with no chlorophyll cannot photosynthesise at all, which is why the white parts of a variegated leaf make no glucose.
- A root cell has no chloroplasts, so a plant depends on its leaves to supply glucose to every other part of it.
- Chlorophyll needs magnesium ions to be made, so a plant short of magnesium turns yellow and photosynthesises slowly.
Reactants, products and the equations
Stoma
A small pore in the surface of a leaf, mostly on the underside, through which carbon dioxide diffuses in and oxygen and water vapour diffuse out.
- The reactants of photosynthesis are carbon dioxide and water, and the products are glucose and oxygen.
- Carbon dioxide diffuses into the leaf from the air through the stomata, which are the pores on the underside of the leaf.
- It then diffuses through the air spaces of the spongy mesophyll and into the mesophyll cells that hold the chloroplasts.
- Water is absorbed from the soil by the root hair cells and carried up to the leaf in the xylem.
- Oxygen diffuses out through the same stomata, and any that the plant does not use for its own respiration is released into the air.
- The word equation is carbon dioxide + water →\rightarrow→ glucose + oxygen.
- Light and chlorophyll are written above the arrow rather than on the left, because they make the reaction happen without being used up in it.
- The balanced symbol equation is 6CO2+6H2O→C6H12O6+6O26CO_2 + 6H_2O \rightarrow C_6H_{12}O_6 + 6O_26CO2+6H2O→C6H12O6+6O2.
- Check the balancing by counting atoms: each side has 666 carbon, 121212 hydrogen and 181818 oxygen atoms.
- The eighteen oxygen atoms on the right are split between the 666 in the glucose and the 121212 in the six molecules of oxygen gas.
- The glucose made is used in several ways: some is respired straight away, some is converted to starch for storage, some to cellulose for new cell walls, and some to lipids for seeds.
- Glucose is also combined with nitrate ions taken up by the roots to build the amino acids the plant needs for its proteins.
- Do not list oxygen as a reactant, because oxygen is a product of photosynthesis and appears on the right of the arrow.
- Do not write light or chlorophyll as reactants, because neither is used up and both belong above the arrow.
- Do not leave the large numbers out of the symbol equation, since an unbalanced equation gains no credit.
- Do not say a plant takes in food through its roots, because it makes its own food in its leaves and takes in only water and mineral ions.
The two stages of the reaction
- Photosynthesis is not a single step; it happens in two stages, and only the first of them needs light directly.
- In the first stage, light energy absorbed by chlorophyll is used to split water molecules apart.
- Splitting the water releases hydrogen, which is held ready for the second stage, and oxygen, which is the by-product that leaves the leaf.
- Splitting water needs a large input of energy, and that is exactly what the absorbed light provides.
- In the second stage, the hydrogen is joined with carbon dioxide to build glucose.
- The second stage does not use light itself, so it depends on the first stage to keep supplying it with hydrogen.
- This is why the whole process stops in the dark: with no light there is no hydrogen, so no glucose can be assembled.
- It also explains why the oxygen released comes from the water rather than from the carbon dioxide.
- Every carbon atom in a plant, and therefore in every animal that eats plants, was once part of a carbon dioxide molecule in the air.
- Almost all the oxygen in the atmosphere was released by the first stage of photosynthesis in plants, algae and bacteria.
Photosynthesis as an endothermic reaction
Endothermic reaction
A reaction that takes energy in from its surroundings, so energy has to be supplied for it to happen.
- An endothermic reaction is one that takes energy in from its surroundings, so energy has to be supplied before it will happen.
- Photosynthesis takes in light energy, which means it cannot run at all unless light is being absorbed.
- The bonds in glucose and oxygen hold more energy than the bonds in carbon dioxide and water, so energy has to be put in to make the change.
- The light energy absorbed is therefore transferred into chemical energy stored in the glucose, where it stays until something respires it.
- Respiration is the opposite, an exothermic reaction that releases the energy the glucose is holding, so the two processes run in opposite directions.
- A plant carries out both at once, photosynthesising only in the light but respiring day and night.
Following the energy from the Sun into a slice of toast
- Light from the Sun falls on a wheat leaf and is absorbed by chlorophyll.
- That energy splits water and the hydrogen released is joined with carbon dioxide to make glucose, so the energy is now stored in chemical bonds.
- The wheat plant converts much of the glucose into starch and stores it in the grain.
- When you eat the bread made from that grain, your cells hydrolyse the starch to glucose and respire it, releasing the same energy to make ATP.
Producers, biomass and the rest of life
Producer
An organism that makes its own food by photosynthesis and so supplies the food and biomass that begins a food chain.
Biomass
The mass of living material in an organism, usually measured as dry mass because water content varies.
- A producer is an organism that makes its own food by photosynthesis, and plants, algae and photosynthetic bacteria are all producers.
- Producers sit at the start of almost every food chain, because they are the only organisms that do not have to eat something else.
- The glucose they make is used to build new plant material, and the mass of that material is called biomass.
- Biomass is measured as dry mass, meaning the mass left after all the water has been driven off, because the amount of water in a living thing varies from hour to hour.
- Only about one or two per cent of the light energy falling on a plant ends up stored in its biomass, because much of the light misses the chloroplasts, passes straight through or is the wrong wavelength.
- Small as that fraction is, it is the energy that supports almost all life on Earth.
- When a herbivore eats a plant, the biomass and the energy stored in it pass along the food chain to the next organism.
- Photosynthetic organisms in the oceans, particularly the microscopic algae of the plankton, produce a large share of the world's biomass and oxygen.
- Fossil fuels are the remains of organisms that photosynthesised long ago, so even the energy in coal and oil arrived through this one reaction.
Investigating photosynthesis in the laboratory
Starch
The coiled, partly branched polysaccharide of glucose monomers that plants use to store glucose.
- Glucose is difficult to detect in a leaf, because it is used and moved almost as soon as it is made.
- A plant converts surplus glucose into starch, which stays put in the leaf, so testing a leaf for starch is the practical way of finding out whether it has photosynthesised.
- Iodine solution is the reagent used, and it turns from orange-brown to blue-black where starch is present.
- Before any experiment the plant has to be destarched by leaving it in a dark cupboard for one or two days.
- Destarching works because the plant keeps respiring in the dark and uses up or moves away the starch already stored in its leaves.
- Any starch found after the experiment must then have been made during the experiment itself, which is what makes the result valid.
- Once the starch test itself is reliable, you can find out which conditions a leaf actually needs by depriving one leaf of one condition at a time.
Testing a leaf for starch
- Aim: to find out whether a leaf contains starch and therefore whether it has been photosynthesising.
- Apparatus: the leaf, a beaker of water on a tripod and gauze over a Bunsen burner, a boiling tube of ethanol, forceps, a white tile, a dropping pipette of iodine solution and eye protection.
- Method:
- Heat the beaker of water until it boils, then use forceps to hold the leaf in the boiling water for about a minute.
- Turn the Bunsen burner off completely before going anywhere near the ethanol.
- Stand the leaf in a boiling tube of ethanol and lower the tube into the hot water, leaving it until the ethanol turns green and the leaf turns pale.
- Lift the pale leaf out with forceps and dip it in warm water for a few seconds to soften it, because ethanol leaves it brittle.
- Spread the leaf flat on a white tile and cover it with drops of iodine solution.
- Results: a blue-black colour shows that starch is present, while a leaf with no starch stays the orange-brown colour of the iodine.
- Watch out: boiling in water kills the leaf and breaks down the membranes so the iodine can reach the starch inside the cells. Boiling in ethanol removes the chlorophyll, because the green colour would otherwise hide the blue-black. Reading the result on a white tile matters, since the colour change is hard to judge against a coloured surface.
- Safety: ethanol is highly flammable, so the Bunsen must be off and the ethanol heated only in a hot water bath, never over a flame. Wear eye protection and use forceps rather than fingers to handle anything hot.
Showing what a leaf needs to make starch
- Aim: to show that light, chlorophyll and carbon dioxide are each needed for photosynthesis.
- Apparatus: destarched potted plants including one with a variegated leaf, aluminium foil and paper clips, two conical flasks with bung and split cork, soda lime, sodium hydrogencarbonate solution, a lamp, and the apparatus for the starch test.
- Variables: the condition being removed is the independent variable, the presence of starch in the leaf is the dependent variable, and the plant, the light period, the temperature and the destarching time are controlled.
- Method, testing whether light is needed:
- Clip a piece of aluminium foil over the middle of one leaf of a destarched plant, covering both surfaces so no light reaches that part.
- Leave the plant in bright light for a full day, then remove the foil and test the whole leaf for starch.
- The uncovered parts turn blue-black while the masked shape stays orange-brown, so starch was only made where light fell.
- Method, testing whether chlorophyll is needed:
- Choose a destarched plant with a variegated leaf, which has green regions containing chlorophyll and white regions without it.
- Leave it in bright light for a day, sketch which parts were green, then test the whole leaf for starch.
- Only the parts that were green turn blue-black, and the white parts stay orange-brown even though light reached them.
- Method, testing whether carbon dioxide is needed:
- Seal one leaf of a destarched plant into a flask containing soda lime, which absorbs carbon dioxide from the air inside.
- Seal a matching leaf into a second flask containing sodium hydrogencarbonate solution, which releases carbon dioxide instead, as the control.
- Split the cork in each bung so that the leaf stalk can pass through without air leaking in, and leave both flasks in the light for a day.
- Test both leaves for starch: the leaf with soda lime makes none, while the control leaf turns blue-black.
- Results: starch is only made where light, chlorophyll and carbon dioxide are all present together, so all three are needed.
- Watch out: only one condition may be removed at a time, or the result cannot be pinned on any one factor. Skipping the destarching invalidates every version, because starch already in the leaf would give a blue-black result whatever the treatment. A leaf sealed in a flask warms up in bright light, so keep both flasks the same distance from the lamp.
- Safety: soda lime is corrosive, so handle it with a spatula and wear eye protection. Follow the safety rules for the starch test whenever ethanol is heated.
Writing about photosynthesis and its experiments
- Put light and chlorophyll above the arrow and keep only carbon dioxide and water on the left, since misplacing them loses the equation mark.
- Name the stage when you describe the process, saying that light splits water in the first stage and that hydrogen joins carbon dioxide in the second.
- Say endothermic and then add that light energy is taken in and stored in glucose, because the term alone rarely earns the explanation mark.
- Explain the destarching step whenever you describe one of these experiments, because it is what makes the result valid.
- Describe a control as the leaf treated identically apart from the one condition removed, and say what it shows.
- Write the balanced symbol equation for photosynthesis and check that it balances.
- Explain why light and chlorophyll are written above the arrow rather than on the left of it.
- Describe what happens in each of the two stages of photosynthesis.
- Explain why photosynthesis is described as an endothermic reaction.
- Explain why a plant has to be destarched before an experiment on what a leaf needs.
- Explain why biomass is measured as dry mass rather than as fresh mass.
1.4.2 Factors affecting the rate of photosynthesis
Measuring the rate of photosynthesis
- The rate of photosynthesis is the amount of product a plant makes in a given time, and it is what changes when the conditions change.
- The most convenient thing to measure is the oxygen given off, because it is a gas and comes off a water plant as visible bubbles.
- The rate can be worked out as rate=volume of oxygentime\text{rate} = \dfrac{\text{volume of oxygen}}{\text{time}}rate=timevolume of oxygen, giving units such as cm3 min−1\text{cm}^3\ \text{min}^{-1}cm3 min−1.
- Counting bubbles per minute is quicker but less precise, because bubbles vary in size and a large one carries far more gas than a small one.
- Two other measures are possible: the volume of carbon dioxide used up, and the increase in dry mass of the plant over a longer period.
- Whichever measure is used, the plant is also respiring, so what you actually record is the net effect of photosynthesis minus respiration.
- In bright light photosynthesis is so much faster than respiration that this correction hardly matters, but in dim light it does.
- Pondweed such as Elodea or Cabomba is used because it lives underwater, so the oxygen it releases collects as bubbles instead of escaping into the air.
Measuring the effect of light intensity on the rate
- Aim: to find out how the rate of photosynthesis in pondweed changes as light intensity changes.
- Apparatus: a fresh piece of pondweed, a boiling tube or large syringe barrel, sodium hydrogencarbonate solution, a large beaker of water, a bright lamp, a metre rule, a capillary tube or gas syringe with a short length of tubing, a thermometer, a stopwatch and a clamp stand.
- Variables: light intensity is the independent variable, the volume of oxygen released per minute is the dependent variable, and the temperature, the carbon dioxide concentration, the piece of pondweed and the length of each timed run are controlled.
- Method, setting up:
- Cut a healthy piece of pondweed and stand it in the boiling tube with the freshly cut end pointing upwards, because that is where the gas escapes.
- Fill the tube with sodium hydrogencarbonate solution, which releases carbon dioxide steadily so the supply never runs short during the experiment.
- Stand the tube inside a large beaker of water and clamp it upright; the water acts as a heat shield and absorbs the heat from the lamp so the temperature stays constant.
- Put a thermometer in the beaker and check it at every distance, since a rise in temperature would change the rate on its own.
- Connect the top of the tube to a capillary tube or gas syringe so the gas given off can be collected and its volume measured.
- Method, taking readings:
- Place the lamp at a measured distance from the tube, starting close to it, and measure the distance to the pondweed itself rather than to the beaker.
- Leave the pondweed for about five minutes so that it settles to a steady rate at that light intensity before you start timing.
- Collect the gas for a fixed time such as five minutes, then measure the length of the gas column or read the syringe volume.
- Repeat the reading at least three times at that distance and calculate a mean, investigating any anomalous result rather than deleting it.
- Move the lamp to the next distance and repeat, using at least five or six distances across a wide range.
- Take a final reading with the lamp switched off and the tube covered, which gives the rate in darkness as a baseline.
- Results: the rate is highest with the lamp closest and falls as the lamp is moved further away, dropping to zero when no light reaches the plant.
- Maths: convert each distance ddd into a relative light intensity using I∝1d2I \propto \dfrac{1}{d^2}I∝d21, then plot rate against 1d2\dfrac{1}{d^2}d21 rather than against distance so the relationship comes out clearly.
- Watch out: the room lights and daylight also reach the pondweed, so the experiment works best in a darkened room. A piece of pondweed that has been cut for too long stops bubbling reliably, so use a fresh piece. Gas can dissolve back into the solution if you leave a long gap before measuring, and the first bubbles after a change in conditions are often uneven, which is why the settling period matters.
- Safety: keep the lamp and its cable away from the water, let a hot lamp cool before moving it, and wash your hands after handling pondweed and hydrogencarbonate solution.
The effect of light intensity
Inverse square law
The rule that the intensity of light from a source is proportional to one divided by the square of the distance from that source.
- Light supplies the energy for the first stage of photosynthesis, in which water is split to release the hydrogen the second stage needs.
- Raising the light intensity means more energy is absorbed by the chlorophyll each second, so water is split faster and glucose is built faster.
- In the dark the rate is zero, because no water is being split, and the only gas exchange you can measure is the plant respiring.
- At low light intensities the rate is roughly proportional to the light intensity, so doubling the intensity roughly doubles the rate.
- As the intensity keeps rising the line begins to level off, because light is no longer the factor holding the rate back.
- Light intensity is hard to measure directly in a school laboratory, so the distance from a lamp is used instead.
- Light spreads out as it travels, so the inverse square law applies: I∝1d2I \propto \dfrac{1}{d^2}I∝d21, where ddd is the distance from the lamp.
- Because the distance is squared, doubling the distance cuts the intensity to a quarter, not to a half.
- Plotting the rate against 1d2\dfrac{1}{d^2}d21 rather than against ddd is therefore what reveals the real relationship.
Turning distances into relative light intensities
- A lamp is placed at 10 cm10\ \text{cm}10 cm, 20 cm20\ \text{cm}20 cm and 50 cm50\ \text{cm}50 cm from a tube of pondweed.
- At 10 cm10\ \text{cm}10 cm the relative intensity is 1102=1100=0.0100\dfrac{1}{10^2} = \dfrac{1}{100} = 0.01001021=1001=0.0100.
- At 20 cm20\ \text{cm}20 cm it is 1202=1400=0.0025\dfrac{1}{20^2} = \dfrac{1}{400} = 0.00252021=4001=0.0025, which is a quarter of the value at 10 cm10\ \text{cm}10 cm.
- At 50 cm50\ \text{cm}50 cm it is 1502=12500=0.0004\dfrac{1}{50^2} = \dfrac{1}{2500} = 0.00045021=25001=0.0004, so moving the lamp five times further away cuts the intensity to a twenty-fifth.
- Those three values, not 101010, 202020 and 505050, are what belong on the horizontal axis of the graph.
The effect of carbon dioxide concentration
- Carbon dioxide is a raw material, and it is used in the second stage of photosynthesis where it is joined with hydrogen to build glucose.
- Raising the carbon dioxide concentration means more molecules reach the chloroplasts each second, so more glucose can be assembled.
- The air contains only about 0.04%0.04\%0.04% carbon dioxide, which is a very small proportion, so carbon dioxide is often the factor holding the rate back on a warm bright day.
- The rate rises steeply as the concentration is increased from a low value, because every extra molecule that arrives can be used.
- The line then levels off, because the chloroplasts cannot process carbon dioxide any faster once light or temperature has become the limit.
- Carbon dioxide has to reach the mesophyll cells by diffusion through the stomata, so anything that closes the stomata also slows photosynthesis.
- A plant short of water closes its stomata to save it, which cuts the carbon dioxide supply and is one reason drought reduces growth.
- Sodium hydrogencarbonate solution is used in rate experiments precisely because it keeps the carbon dioxide concentration high and steady.
- A tube of pondweed left in still water can run its carbon dioxide down, which makes the rate fall for a reason that has nothing to do with the light.
The effect of temperature
Optimum temperature
The temperature at which an enzyme-controlled process works at its fastest rate.
Denaturation
The permanent change in the folded shape of a protein, caused by a high temperature or an extreme pH, which stops the protein working.
- Every step of photosynthesis is controlled by an enzyme, so temperature affects the rate in the same way it affects any enzyme-controlled reaction.
- Raising the temperature gives the enzymes and their substrates more kinetic energy, so they move faster and collide more often.
- More frequent collisions with enough energy to react means more successful reactions per second, so the rate rises.
- The rate keeps rising until the optimum temperature is reached, which is the temperature at which the process runs fastest.
- Above the optimum the rate falls sharply, because the enzymes begin to denature as the bonds holding their folded shape are broken.
- A denatured enzyme has an active site that no longer fits its substrate, so it stops catalysing its step and the whole pathway slows.
- For most plants the optimum is somewhere around 25 ∘C25\ ^\circ\text{C}25 ∘C to 30 ∘C30\ ^\circ\text{C}30 ∘C, and denaturation becomes serious above roughly 40 ∘C40\ ^\circ\text{C}40 ∘C to 45 ∘C45\ ^\circ\text{C}45 ∘C.
- At low temperatures nothing is denatured, so the rate is slow but recovers as soon as the plant is warmed again.
- That difference is what makes the temperature graph asymmetrical: it climbs to a peak and then drops away steeply, rather than levelling off.
- Do not write that enzymes are killed at high temperature, because an enzyme is a molecule and the correct word is denatured.
- Do not describe the temperature graph as a plateau, because the rate falls away above the optimum instead of staying level.
- Do not say that a cold plant has been damaged, since a low temperature only slows the enzymes and the effect is reversible.
- Do not use the word optimum to mean the hottest temperature tested, because it means the temperature that gives the fastest rate.
The shape of a single-factor graph
Limiting factor
The factor in shortest supply at a given moment, which is holding the rate of a process back so that only increasing that factor increases the rate.
- A graph of rate against light intensity or against carbon dioxide concentration has the same two-part shape.
- The first part is a steep straight rise, and along that stretch the factor on the horizontal axis is the limiting factor.
- The gradient of that straight stretch tells you how much extra rate each extra unit of that factor buys.
- The second part is a plateau, where the line runs flat and adding more of that factor changes nothing at all.
- A plateau means the factor on the axis has stopped being the limiting one, and something else is now holding the rate back.
- The point where the line stops rising and starts to flatten is therefore the point at which the limiting factor changes over.
- A graph of rate against temperature looks different, rising to a peak at the optimum and then falling, because the enzymes are being denatured rather than simply working at full stretch.
- Reading the rate from any of these graphs means finding the value on the vertical axis, and finding a rate of change means taking a gradient.
Explaining an effect on the rate
- Say what the factor is used for before you say what happens, for example that light splits water or that carbon dioxide is a raw material.
- Use the words rate of photosynthesis rather than amount, because a rate is a quantity per unit time.
- Explain a plateau by naming a factor that has become limiting instead of writing that the rate stays the same.
- Explain a fall above the optimum through denaturation and the change in the shape of the active site.
- Convert distances to 1d2\dfrac{1}{d^2}d21 before you comment on a light-intensity result, because a comment about distance alone is the wrong quantity.
- Quote a value with its unit when you read a graph, since a bare number is often not credited.
- State two things that could be measured to find the rate of photosynthesis in pondweed.
- Explain why measuring the volume of gas is more precise than counting bubbles.
- Calculate the relative light intensity at a distance of 25 cm25\ \text{cm}25 cm from a lamp.
- Explain why the rate of photosynthesis falls at temperatures above the optimum.
- Explain why the rate rises steeply and then plateaus on a graph of rate against carbon dioxide concentration.
- Explain why a beaker of water is placed between the lamp and the pondweed.
1.4.3 Limiting factors in photosynthesis
What it means for a factor to be limiting
Limiting factor
The factor in shortest supply at a given moment, which is holding the rate of a process back so that only increasing that factor increases the rate.
- Photosynthesis needs light, carbon dioxide and a suitable temperature all at once, and it can only run as fast as the least favourable of them allows.
- The limiting factor is whichever of them is furthest from its ideal level at that moment, because it is the one setting the ceiling on the rate.
- Only one factor is limiting at any given moment, and increasing any of the others has no effect at all while it stays that way.
- Increasing the limiting factor does raise the rate, and it keeps raising it until a different factor becomes the one in shortest supply.
- Once that happens, further increases in the first factor stop working and the second factor has to be raised instead.
- This is why speeding photosynthesis up in practice usually means raising two or three factors together rather than one on its own.
- On a bright but cold spring morning there is plenty of light, so temperature is the limiting factor and warming the plant is what raises the rate.
- In a warm, well-lit glasshouse the plant has light and warmth to spare, so carbon dioxide is usually the limiting factor because air holds so little of it.
- Deep inside a dense crop canopy the lower leaves are shaded by the ones above, so light is limiting for them even at midday.
- Water is a reactant too, but a plant short of water wilts and closes its stomata long before the shortage limits the reaction directly.
- A shortage of chlorophyll, caused by disease or by too little magnesium in the soil, can also hold the rate back whatever the conditions are.
How the limiting factor changes
- The limiting factor is not fixed; it changes as conditions change, so the same plant can be held back by different things at different times.
- Just before dawn there is no light at all, so no photosynthesis happens and the plant is only respiring.
- Through the early morning light intensity climbs quickly while the air is still cool, so light is limiting first and then temperature takes over.
- By the middle of a summer day both light and temperature are high, so carbon dioxide becomes the limiting factor.
- On a hot afternoon a plant short of water may close its stomata to reduce water loss, which cuts off the carbon dioxide supply and slows the rate further.
- Late in the evening light intensity falls away again and light becomes limiting for the second time that day.
- Across the seasons the pattern repeats on a longer scale, with temperature and day length limiting growth in a British winter and carbon dioxide limiting it on a bright summer day.
- This is why a crop grown outdoors in the United Kingdom puts on most of its biomass between late spring and late summer.
A tomato plant through one summer day
- At 555 a.m. the glasshouse is dark, so the rate is zero and the plant is respiring only.
- By 777 a.m. the light is climbing but the air is still at 12 ∘C12\ ^\circ\text{C}12 ∘C, so the rate is low and temperature is limiting.
- By 111111 a.m. the air has reached 25 ∘C25\ ^\circ\text{C}25 ∘C and the light is bright, so the plant is drawing carbon dioxide out of the air faster than it can diffuse in, and carbon dioxide is limiting.
- Opening a vent to let fresh air in raises the rate, while switching a lamp on at that moment would make no difference at all.
Reading graphs with more than one curve
- A graph that shows the interaction of two factors carries more than one curve, and each curve was measured at a different fixed level of the second factor.
- A graph of rate against light intensity, for instance, might carry one curve at 0.04%0.04\%0.04% carbon dioxide and a second at 0.4%0.4\%0.4% carbon dioxide.
- Along the steep part of any curve, the factor plotted on the horizontal axis is the limiting factor, because raising it raises the rate.
- Where a curve flattens into a plateau, the factor on the horizontal axis has stopped being limiting and the second factor has taken over.
- The height of a plateau tells you how much the second factor is allowing, so the curve measured with more carbon dioxide plateaus at a higher rate.
- The plateau on the upper curve also begins at a higher light intensity, because the plant can keep making use of extra light for longer before carbon dioxide runs short.
- To name the limiting factor at any labelled point, look at whether the curve is still rising there or has already levelled off.
- If it is still rising, the factor on the axis is limiting; if it has levelled off, the factor that differs between the curves is limiting.
- Two curves that lie on top of one another over the first stretch and only separate later show that the second factor was not limiting at low values of the first.
Working through a two-curve light-intensity graph
- Two curves show the rate of photosynthesis against light intensity, one at 0.04%0.04\%0.04% carbon dioxide and one at 0.4%0.4\%0.4%.
- Both curves rise together along the first steep stretch, so light is the limiting factor for both and the extra carbon dioxide is making no difference yet.
- The lower curve flattens at a rate of 202020 arbitrary units, which means carbon dioxide has become limiting for it at that point.
- The upper curve keeps rising and only flattens at 454545 units, because the higher carbon dioxide concentration lets the plant use more of the light.
- The difference between the plateaus is 45−20=2545 - 20 = 2545−20=25 units, and that gain came entirely from the tenfold increase in carbon dioxide.
- At a light intensity beyond both plateaus, adding more light does nothing to either curve, so the answer to what is limiting there is carbon dioxide.
Controlling the factors to raise crop yield
- A commercial grower controls all three factors at once inside a glasshouse or polytunnel, so that none of them is holding the crop back for long.
- Artificial lighting extends the working day and keeps the rate up in dull weather and through a British winter.
- Heaters and thermostats hold the temperature near the optimum, and ventilation stops it climbing past the point where enzymes start to denature.
- Carbon dioxide enrichment raises the concentration well above the 0.04%0.04\%0.04% in ordinary air, which is often the single largest gain available.
- A paraffin or propane burner is a common way of doing this because it raises the temperature and releases carbon dioxide at the same time, dealing with two factors from one piece of equipment.
- A faster rate of photosynthesis means more glucose, so more biomass, so a larger yield of fruit or leaf that the grower can sell.
- Controlling the conditions also lets a crop be grown out of season, when the price it fetches is higher.
- None of it is free, though, because lamps, heat and carbon dioxide all cost money, and the extra crop has to be worth more than the extra cost.
- A grower therefore aims for the most profitable rate rather than the fastest possible one, and will let a factor stay slightly limiting if removing that limit costs more than the extra crop earns.
- This is a straightforward comparison to make: if enrichment costs an extra £900\pounds 900£900 per week and lifts the crop's value by £1400\pounds 1400£1400 per week, it is worth doing.
Answering interaction and graph questions
- Name the limiting factor explicitly, because an answer that says the rate levels off without saying why gains little.
- Check whether the curve is still rising or already flat at the point the question names, since that is what identifies the limiting factor.
- Say that the second factor has become limiting when you explain a plateau, and name which factor it is.
- Explain a higher plateau by naming the factor that was increased and stating that it had been limiting the lower curve.
- Bring cost into an evaluation question about a grower, because a yield answer with no mention of cost misses the balance the question is asking for.
- Read values off both axes with their units when a question asks you to compare two curves at a stated point.
- State what is meant by a limiting factor.
- Explain why increasing light intensity does not always increase the rate of photosynthesis.
- Explain which factor is most likely to be limiting in a warm, brightly lit glasshouse and why.
- Describe what a higher plateau on a second curve tells you about the factor that was changed.
- Explain why a paraffin burner is a useful piece of equipment in a glasshouse.
- Explain why a grower may choose not to remove a limiting factor completely.