6.1.1 Field investigation of distribution and abundance
Why ecologists take samples
Habitat
A habitat is the place in which an organism lives.
Population
A population is all the organisms of one species living in a defined area at the same time.
Random sampling
Random sampling is sampling in which every position in the habitat has an equal chance of being selected, so the sample is unbiased.
- A habitat holds far more organisms than anyone could count one by one, so an ecologist measures a small part of it and scales the result up to the whole area.
- The small part that is measured is called a sample, and the values recorded in it are used to estimate the values for the whole habitat.
- Counting every individual would take far too long, would trample and damage the habitat, and would be impossible for organisms that are buried, hidden under stones or moving between areas.
- A sample is only useful if it is representative, meaning the species and their proportions inside the sample match those across the whole habitat.
- Choosing where to place a sample by eye introduces bias, because a person is drawn towards patches that look unusual, easy to reach or rich in the species being studied.
- Random sampling removes that bias by using a random number generator to select the coordinates of each sample position, so every point in the habitat has the same chance of being chosen.
- A single sample may land on an unusual patch, so many samples are taken and a mean is calculated, which makes the estimate more reliable.
- Two separate measurements are taken from the samples: abundance, which answers how many, and distribution, which answers whereabouts.
The greater the number of samples taken, the closer the mean is likely to be to the true value for the whole habitat.
Abundance, distribution and density
Abundance
Abundance is the number of individuals of a species present in a given area.
Distribution
Distribution is the pattern of where a species is found across a habitat.
Population density
Population density is the mean number of individuals of a species per unit area of habitat.
- Abundance is recorded either as a count of individuals, as a percentage cover, or on a descriptive scale such as abundant, common, frequent, occasional and rare.
- Counting individuals works for animals and for plants that grow as separate units, such as daisies, dandelions and plantains.
- Percentage cover is used instead for plants that spread sideways into a mat, such as grass, moss or clover, where one plant cannot be separated from the next.
- Population density allows two habitats of different sizes to be compared fairly, because it is always expressed per unit area.
- Density is calculated as density=number of individualsarea\text{density}=\dfrac{\text{number of individuals}}{\text{area}}density=areanumber of individuals and is written with units such as m−2\text{m}^{-2}m−2.
- Distribution describes the pattern across the habitat, for example whether a species is spread evenly, clumped into patches, or restricted to one end of the area.
- A pattern in distribution is usually explained by an abiotic factor that changes across the habitat, such as light intensity, soil moisture, soil pH, temperature or exposure to wind.
- A pattern may also be explained by a biotic factor, such as competition for light from a taller species or grazing by rabbits along one edge of a field.
- Do not give a number of individuals when a question asks about distribution.
- Abundance is how many individuals are present, and distribution is whereabouts in the habitat they are found.
Equipment for collecting organisms
Quadrat
A quadrat is a square frame of known area placed on the ground so that the organisms inside it can be counted or estimated.
Pooter
A pooter is a sealed jar fitted with two tubes that is used to draw small invertebrates into the jar without touching or harming them.
Identification key
An identification key is a series of paired statements about observable features that is followed step by step to name an unknown organism.
- A quadrat is a rigid square frame of known area, commonly 0.5 m×0.5 m0.5\ \text{m}\times0.5\ \text{m}0.5 m×0.5 m, which encloses an area of 0.25 m20.25\ \text{m}^20.25 m2.
- A gridded quadrat is divided by wires into 100100100 small squares, so the number of small squares a species occupies can be read straight off as a percentage cover.
- A pooter is used for small insects: the collector sucks on one tube while the other tube is held over the insect, and the insect is drawn into the jar by the moving air.
- A fine gauze is fixed across the inner end of the mouth tube, which stops the insect or any dust being drawn into the collector's mouth.
- A sweep net is swung through long grass in a figure of eight, and the invertebrates knocked off the stems collect in the bag at the end of each sweep.
- A pond net is swept through open water and through weed, and the catch is emptied into a shallow white tray so that pale, small animals show up clearly against the background.
- A pitfall trap is a container sunk into the soil with its rim level with the surface, so that ground-dwelling invertebrates walk in and fall to the bottom.
- A stone raised on pebbles is placed over the pitfall trap, which keeps out rain and stops birds taking the catch.
- A beating tray is held under a branch while the branch is tapped sharply, so that the invertebrates living on the leaves drop onto the sheet and can be collected.
- An identification key is then used to name what has been caught, using paired statements about visible features that are followed one step at a time until a single species is left.
- A key only gives the right answer if each feature is checked properly, so specimens are examined in a tray or under a hand lens rather than identified from memory.
Traps and nets are emptied carefully and the organisms are returned to the exact place they were collected from, so the habitat is left as it was found.
Estimating the abundance of a plant species using quadrats
- Aim: to estimate the mean number of daisy plants per square metre on a school field, and to use that mean to estimate the total number on the whole field.
- Apparatus: a 0.5 m×0.5 m0.5\ \text{m}\times0.5\ \text{m}0.5 m×0.5 m gridded quadrat, two 30 m30\ \text{m}30 m tape measures, a random number generator or table of random numbers, a trundle wheel for measuring the field, a results table, a clipboard, a pencil and a calculator.
- Method, setting up the sampling area:
- Lay one tape measure along one edge of the field and the second tape at right angles to it from the same corner, so the two tapes act as the axes of a grid.
- Measure the length and the width of the whole field with the trundle wheel and record both, because the total area is needed at the end.
- Generate pairs of random numbers, using the first number of each pair as the distance along the first tape and the second number as the distance along the second tape.
- Method, taking the samples:
- Walk to the first pair of coordinates and place the quadrat flat on the ground with its corner on that point, then leave it where it lands rather than shifting it to a tidier patch.
- Count every daisy plant rooted inside the quadrat, and count a plant on the boundary only if it is rooted inside the two chosen adjacent sides, so that no plant is counted twice.
- Record the count in the results table beside the coordinates used.
- Repeat for at least 101010 further quadrat positions, each one chosen by a new pair of random numbers.
- Take all the readings on the same day and in the same weather, because trampling and growth change the field over time.
- Results: record the quadrat number and the count of daisies in a table, then add a row for the total and a row for the mean number per quadrat.
- Maths: divide the total count by the number of quadrats to find the mean per quadrat, then convert to a density with density=mean countquadrat area\text{density}=\dfrac{\text{mean count}}{\text{quadrat area}}density=quadrat areamean count, and finally estimate the population with population=density×total area\text{population}=\text{density}\times\text{total area}population=density×total area.
- Watch out: placing the quadrat by eye or throwing it makes the sample biased, too few quadrats give a mean that swings wildly between repeats, and counting plants rooted just outside the frame inflates every count.
- Safety: check the ground for broken glass and animal waste before kneeling, wash hands after handling soil and plants, and do not sample close to water or a road.
Scaling a sample up to a population estimate
Percentage cover
Percentage cover is the proportion of the area inside a quadrat that is occupied by one species, expressed as a percentage.
- The mean number per quadrat is found by adding the counts from every quadrat and dividing by the number of quadrats used.
- The mean is then converted into a population density using density=mean number per quadratarea of one quadrat\text{density}=\dfrac{\text{mean number per quadrat}}{\text{area of one quadrat}}density=area of one quadratmean number per quadrat.
- The estimated total population is found with population=density×total area of the habitat\text{population}=\text{density}\times\text{total area of the habitat}population=density×total area of the habitat.
- The same calculation can be done in one step with population=total areaarea of one quadrat×mean number per quadrat\text{population}=\dfrac{\text{total area}}{\text{area of one quadrat}}\times\text{mean number per quadrat}population=area of one quadrattotal area×mean number per quadrat.
- Both areas must be in the same unit before dividing, so a quadrat area given in cm2\text{cm}^2cm2 is converted to m2\text{m}^2m2 first, using 1 m2=10 000 cm21\ \text{m}^2=10\,000\ \text{cm}^21 m2=10000 cm2.
- Percentage cover is estimated from a gridded quadrat by counting the small squares that are more than half filled by the species, then treating that count as a percentage.
- Percentage cover is scaled up to an area rather than to a number, so 40%40\%40% cover across a 200 m2200\ \text{m}^2200 m2 field means about 80 m280\ \text{m}^280 m2 of the field is covered by that species.
- The answer is always an estimate, because it is calculated from a small fraction of the habitat rather than from a complete count.
Estimating a daisy population on a field
- Eleven quadrats of area 0.25 m20.25\ \text{m}^20.25 m2 are sampled and give a total of 777777 daisies on a field measuring 40 m40\ \text{m}40 m by 25 m25\ \text{m}25 m.
- Mean number per quadrat: 7711=7\dfrac{77}{11}=71177=7 daisies.
- Population density: 70.25=28\dfrac{7}{0.25}=280.257=28 daisies per m2\text{m}^2m2.
- Total area of the field: 40×25=1000 m240\times25=1000\ \text{m}^240×25=1000 m2.
- Estimated population: 28×1000=28 00028\times1000=28\,00028×1000=28000 daisies.
Answering scaling-up questions
- Write the mean per quadrat down as a separate line before scaling, because that value carries a mark of its own even when the final answer is wrong.
- Check the quadrat area rather than assuming it, since a 0.5 m0.5\ \text{m}0.5 m quadrat has an area of 0.25 m20.25\ \text{m}^20.25 m2 and dividing by 0.50.50.5 halves the answer instead of doubling it.
- Give the answer as a whole number of organisms and state that it is an estimate.
- Quote the unit on a density, written as per m2\text{m}^2m2 or as m−2\text{m}^{-2}m−2.
Using a transect to study distribution
Transect
A transect is a line laid across a habitat along which samples are taken at set intervals to show how distribution changes.
Abiotic factor
An abiotic factor is a non-living physical or chemical feature of the environment that affects organisms.
- Random sampling spreads quadrats evenly over a whole area, so it estimates abundance well but hides any pattern that runs in one direction.
- A transect is used instead when the question is how a species changes across a gradient, such as from open grass into the shade under a hedge, or from the water's edge up a sand dune.
- A transect is systematic sampling, because the sampling points are set at fixed intervals along a line rather than chosen at random.
- A line transect records only the species that touch the line at each marked point, which is quick and suits a steep, narrow gradient.
- A belt transect places a quadrat at each interval along the line and records abundance inside it, which gives quantitative data at every point.
- A continuous belt transect places quadrats end to end with no gaps, while an interrupted belt transect places them at set intervals such as every 2 m2\ \text{m}2 m, which covers a long gradient in a reasonable time.
- At every point, the abundance of the species and the value of at least one abiotic factor are recorded, so the two sets of data can be compared.
- Light intensity is measured with a light meter, air and soil temperature with a thermometer, soil pH with a pH probe, and soil water with a moisture meter.
- The results are plotted with distance along the transect on the horizontal axis, so that abundance and the abiotic factor can be read against the same scale.
- A matching rise and fall in the two lines shows a correlation between the species and that factor, but it does not by itself prove the factor is the cause.
Investigating how a species is distributed along a transect
- Aim: to investigate how the percentage cover of a shade-tolerant plant changes with light intensity on a transect running from open grass into the shade of a hedge.
- Apparatus: a 20 m20\ \text{m}20 m tape measure, tent pegs, a 0.5 m×0.5 m0.5\ \text{m}\times0.5\ \text{m}0.5 m×0.5 m gridded quadrat, a light meter, a soil moisture meter, a thermometer, a results table, a clipboard and a pencil.
- Method, laying the transect:
- Choose a line that runs straight across the gradient, from fully open grass to the deepest shade beneath the hedge.
- Lay the tape measure along that line and secure both ends with tent pegs so the tape cannot be pulled out of position.
- Mark the sampling points at fixed 2 m2\ \text{m}2 m intervals along the tape.
- Method, taking the readings:
- Place the quadrat on the same side of the tape at each interval, with one corner on the mark, so every sample is positioned in the same way.
- Count the small squares more than half covered by the plant and record that number as the percentage cover.
- Hold the light meter just above the vegetation at the centre of the quadrat, with the sensor facing upwards, and record the light intensity.
- Push the moisture meter probe into the soil to the same depth at every point and record the reading once it steadies.
- Work along the transect without standing on the quadrat positions ahead, because trampled vegetation gives a false low reading.
- Repeat the whole transect along two more parallel lines a few metres apart and calculate a mean for each distance, which shows whether the pattern is real or particular to one line.
- Results: tabulate distance along the transect against percentage cover, light intensity and soil moisture, then plot percentage cover and light intensity against distance on the same axes.
- Maths: calculate the mean percentage cover at each distance from the three transects, and describe the trend by quoting figures from each end, for example a fall from 70%70\%70% in the open to 15%15\%15% under the hedge.
- Watch out: readings taken over several hours are not comparable because the sun moves, a shadow cast by the person holding the meter lowers the light reading, and a transect laid along the gradient rather than across it shows no change at all.
- Safety: wear gloves when working near a hedge with thorns, keep away from unstable banks and open water, and wash hands after handling soil.
Capture-recapture for animals that move
Capture-recapture
Capture-recapture is a method of estimating the size of an animal population by marking a first sample and recording how many marked individuals are caught in a second sample.
- Quadrats are useless for animals that run, fly or swim away, because the animal leaves the frame before it can be counted.
- Capture-recapture is used instead, and it estimates the population from the proportion of marked animals that turn up in a second catch.
- A first sample is caught, the number is recorded, every animal is marked harmlessly, and all of them are released back into the same place.
- Enough time is left for the marked animals to mix evenly back into the population, usually one or two days for small mammals.
- A second sample is then caught in the same way, and the total caught and the number carrying a mark are both recorded.
- The population is estimated with N=n1×n2m2N=\dfrac{n_1\times n_2}{m_2}N=m2n1×n2, where n1n_1n1 is the number caught and marked first, n2n_2n2 is the number caught in the second sample and m2m_2m2 is the number of marked animals in that second sample.
- A small proportion of marked animals in the second catch means the marked individuals were diluted by a large population, so the estimate comes out high.
- The method assumes there are no births, deaths, immigration or emigration between the two samples.
- It also assumes the mark stays on and is not washed, rubbed or licked off, since a lost mark makes the population look larger than it is.
- It assumes the mark does not affect survival, so a bright paint that makes an animal easier for a predator to see would push the estimate too high.
- Finally it assumes every individual has an equal chance of being caught, which fails if an animal trapped once learns to avoid the trap, or returns to it for the bait.
Estimating a woodlouse population
- A first sample of 606060 woodlice is caught under logs, marked on the underside with a dot of non-toxic paint and released.
- Two days later a second sample of 808080 woodlice is caught from the same logs, and 161616 of them carry a mark.
- Substituting into N=n1×n2m2N=\dfrac{n_1\times n_2}{m_2}N=m2n1×n2 gives N=60×8016N=\dfrac{60\times80}{16}N=1660×80.
- The estimated population is 300300300 woodlice.
Answering capture-recapture questions
- Label the three numbers in the question before substituting, because marks are most often lost by putting the number of marked recaptures on the top line.
- Write the equation out in full first, since it earns a mark even when the arithmetic that follows is wrong.
- Round the answer to a whole number of animals, because a fraction of an organism cannot exist.
- When asked to comment on the estimate, name one assumption and say which way it would shift the answer, for example that marks rubbing off would make the estimate too large.
Making a field investigation reliable
- The same size of quadrat is used throughout, because counts from quadrats of different areas cannot be combined into one mean.
- The same person estimates percentage cover for the whole investigation, since two people judge the halfway point of a small square differently.
- All the samples are taken on the same day and at a similar time, because light, temperature and animal activity change through the day and through the season.
- At least ten samples are taken, and more are added until the running mean stops changing much, which shows that enough of the habitat has been covered.
- An anomalous result is identified before the mean is calculated and is checked rather than quietly deleted, for example a quadrat that happened to land on a footpath.
- Repeating a transect along two or three parallel lines shows whether a pattern holds across the habitat or was a feature of one line.
- The method is described in enough detail for another student to repeat it exactly, which is what makes the results reproducible.
- Do not claim that an abiotic factor causes a pattern in distribution just because the two change together.
- Factors that were never measured, such as grazing, trampling or competition, may be responsible for the pattern.
- Say instead that the data show a correlation, and name a further factor that would need to be measured.
- State the difference between the abundance and the distribution of a species.
- Explain why quadrat positions are chosen using random numbers rather than by eye.
- A mean of 666 plants is counted per 0.25 m20.25\ \text{m}^20.25 m2 quadrat on a field of 800 m2800\ \text{m}^2800 m2. Calculate the estimated population.
- Describe how a belt transect is set up and what is recorded at each point along it.
- Write the equation used to estimate a population size by capture-recapture and say what each term stands for.
- Give two assumptions made in the capture-recapture method.
6.1.2 Human interactions and biodiversity
How humans interact with ecosystems
Ecosystem
An ecosystem is a community of organisms interacting with one another and with the non-living components of their environment.
Biodiversity
Biodiversity is the variety of living organisms, including variation within species and the range of species and ecosystems.
- Every human activity that takes something from an ecosystem, or puts something into it, changes the conditions the organisms living there depend on.
- Negative interactions reduce biodiversity, and the three main groups are destroying habitats through land use, removing organisms by hunting and fishing, and releasing pollutants.
- Positive interactions protect or raise biodiversity, and they include conserving individual species, protecting whole habitats and cutting the amount of waste released.
- The size of the human population and the resources each person uses set the scale of the pressure, because more food, land, energy and materials are needed each year.
- Biodiversity falls when species are lost from an area, and the loss is measured as a drop in the number of different species rather than a drop in the total number of organisms.
- A change that removes one species rarely stops there, because the species in a community are linked by feeding, shelter and pollination.
An area planted with millions of identical conifers holds a huge number of organisms but a very low biodiversity, because almost all of them belong to the same few species.
Land use destroys habitats
Habitat destruction
Habitat destruction is the loss or damage of the place where a species lives, so that the species can no longer survive there.
Deforestation
Deforestation is the permanent removal of trees from a large area of land.
Monoculture
A monoculture is a large area of land planted with a single crop species.
- Land is cleared for housing, roads, shops, factories, quarries, landfill sites and farmland, and each of these replaces a living habitat with a surface that supports almost nothing.
- Deforestation removes the trees that provide food, nesting sites and shade, so the species that depend on them have nowhere to feed or breed.
- Tree roots hold the soil together, so once the trees are gone the topsoil is washed away by rain, which is called soil erosion.
- Cutting and burning forest also releases the carbon locked in the wood as carbon dioxide, and removes the trees that were absorbing carbon dioxide for photosynthesis.
- Draining a peat bog for fuel or compost destroys a habitat that only specialised plants such as sphagnum moss and sundew can live in, and those species cannot simply move elsewhere.
- Drained peat also begins to decompose, and the decomposers respire, releasing stored carbon as carbon dioxide.
- Modern farming replaces mixed vegetation with a monoculture, so a field that once held dozens of plant species and the insects feeding on them now holds one.
- Removing hedgerows to make larger fields destroys a habitat used for nesting and shelter, and also removes the corridor that allowed animals to travel safely between woods.
- Clearing land in patches leaves fragmented habitats, and a small isolated patch supports fewer species and cuts populations off from one another.
- Isolated populations cannot interbreed, so each one ends up with fewer alleles and less chance of adapting if conditions change.
- Herbicides and insecticides used on farmland remove the wild plants and insects that other species feed on, even when those organisms were not the target.
Hedgerow loss on British farmland
- Hedgerows were pulled out across British farmland during the twentieth century so that larger machinery could work bigger fields.
- A hedgerow is a habitat in its own right, holding hawthorn, bramble and wild flowers, along with the insects that feed on them.
- Nesting birds such as the yellowhammer lost their nest sites, and their numbers on farmland fell as a result.
- Hedgehogs and dormice lost the sheltered routes they used to cross open ground, so their populations became isolated in separate patches.
- Replanting hedges and leaving uncut margins around fields restores both the habitat and the corridor between habitats.
Hunting and overfishing remove species
Endangered species
An endangered species is a species whose population has fallen so low that it is at risk of extinction.
Extinction
Extinction is the permanent loss of every living member of a species.
- Animals are hunted for meat, for skins and fur, for ivory and horn, for traditional medicines and for sport.
- Hunting only reduces a population permanently when individuals are killed faster than the species can replace them by breeding.
- Species that breed slowly, have few young and mature late are the most vulnerable, which is why rhinoceroses and whales were driven to low numbers far faster than rabbits ever could be.
- A species whose numbers fall this far becomes endangered, and if the last individuals die the species becomes extinct and its alleles are lost for good.
- Overfishing takes fish from the sea faster than the stock can breed, so the number of adults left to spawn each year keeps falling.
- Fine-meshed nets make this worse by catching young fish before they have bred at all.
- Nets also catch species that were never the target, such as dolphins, turtles and seabirds, and this unwanted catch is called bycatch.
- Trawling a net along the sea floor drags up the seabed itself, destroying the habitat that shellfish and corals were living in.
Hunting and fishing are only sustainable while the number removed each year is no greater than the number the population produces in that year.
Pollution of land, water and air
Pollution
Pollution is the release of a harmful substance into the air, water or land.
Eutrophication
Eutrophication is the process in which nutrients entering a body of water cause rapid algal growth that leads to a fall in the dissolved oxygen concentration.
Acid rain
Acid rain is rain with a pH lower than normal, formed when sulfur dioxide and nitrogen oxides dissolve in water in the atmosphere.
- Land is polluted by household waste sent to landfill, by toxic waste from industry, and by pesticides and herbicides sprayed onto crops.
- Plastics are non-biodegradable, meaning decomposers have no enzymes that break them down, so they stay in the environment for hundreds of years.
- Animals become entangled in discarded netting and packaging, and others swallow plastic that blocks the gut so that the animal starves with a full stomach.
- Plastic breaks into fragments called microplastics, which are small enough to be eaten by plankton and so pass into the food chain.
- Water is polluted by untreated sewage, by fertiliser washed off fields, by oil spills and by toxic chemicals discharged from factories.
- Fertiliser causes eutrophication, and the sequence runs through six clear steps.
- Rain washes nitrates and phosphates from the fertilised field into a river or lake, which is called leaching.
- The extra nitrate removes the shortage that was limiting algal growth, so algae reproduce rapidly and form an algal bloom across the surface.
- The bloom blocks the light, so the plants rooted below can no longer photosynthesise.
- Those plants die, and the algae at the surface die soon afterwards once the nitrate runs out.
- Decomposing bacteria feed on the dead material and multiply rapidly.
- The bacteria respire aerobically and use up the dissolved oxygen, so fish and aerobic invertebrates suffocate and die.
- Untreated sewage has the same effect twice over, because it adds nutrients and it also feeds the decomposers directly with organic matter.
- Air is polluted by smoke, soot and gases released when fossil fuels are burned in power stations, factories and vehicles.
- Fossil fuels contain sulfur, so burning them releases sulfur dioxide, and the high temperatures inside an engine also produce nitrogen oxides.
- These gases dissolve in water droplets in the clouds and fall as acid rain, often hundreds of kilometres from where they were released.
- Acid rain lowers the pH of lakes so that fish eggs fail to hatch, damages the waxy cuticle on tree leaves, and washes aluminium ions out of the soil into rivers where they damage fish gills.
- Do not write that algae use up the oxygen in eutrophication.
- The oxygen is used by the decomposing bacteria respiring aerobically on the dead plants and algae.
- Name the bacteria and name aerobic respiration, because both are needed for the final marks.
Indicator species reveal pollution
Indicator species
An indicator species is a species whose presence or absence in a habitat shows the level of pollution in that habitat.
- Species differ in how much pollution they can tolerate, so which species are present at a site is itself a measurement of how polluted that site is.
- An indicator species may work in either direction: a sensitive species indicates clean conditions by being present, and a tolerant species indicates pollution by being present in large numbers.
- Lichens indicate air quality, because they absorb water and dissolved gases straight across their surface and so take in sulfur dioxide with no barrier.
- Bushy and leafy lichens have a large surface area exposed to the air and grow only where it is clean, while flat crusty lichens tolerate moderate pollution and bare bark or algae alone indicates heavily polluted air.
- Freshwater invertebrates indicate water quality, because the sensitive species need a high concentration of dissolved oxygen.
- Stonefly nymphs and mayfly nymphs are found only in clean, well oxygenated water, and freshwater shrimps need reasonably clean water.
- Bloodworms and sludgeworms survive where oxygen is very low because they contain haemoglobin that binds oxygen strongly, and a rat-tailed maggot breathes air through a tube at the surface, so it does not depend on dissolved oxygen at all.
- Living indicators are cheap, need no equipment and show the conditions over weeks rather than at one instant.
- Living indicators are also only qualitative, they cannot say which pollutant is present, and a species may be absent for a reason that has nothing to do with pollution.
- Non-living indicators give a number instead, using a dissolved oxygen meter, a nitrate test kit, a pH probe or an electronic sulfur dioxide monitor, so the result is quantitative and can be compared between sites.
- The two approaches are used together, because the meter says how polluted the water is now and the invertebrates say what the water has been like for some time.
Using freshwater invertebrates to compare water quality at two sites
- Aim: to compare the invertebrate indicator species in a stream upstream and downstream of a farm outflow, and to check the result against a dissolved oxygen reading.
- Apparatus: a pond net, two white sampling trays, a plastic pipette, a hand lens, a freshwater invertebrate identification key, a dissolved oxygen meter, a thermometer, a stopwatch, a tally chart, waterproof boots and gloves.
- Method, sampling the upstream site:
- Half fill a white tray with stream water and set it on the bank ready for the catch.
- Stand downstream of the net and disturb the gravel with your boot for exactly 303030 seconds, so the animals living among the stones are swept into the net by the current.
- Empty the net into the tray straight away, because small invertebrates die quickly once out of the water.
- Use the pipette to move each animal into a separate corner of the tray, identify it with the key and the hand lens, and record it on the tally chart.
- Lower the oxygen meter probe to mid depth, wait for the reading to settle and record the dissolved oxygen concentration and the water temperature.
- Method, sampling the downstream site:
- Repeat every step at a point below the outflow, using the same net, the same 303030 second disturbance and the same depth of water, so that only the site differs.
- Take three samples at each site and work out a mean count for each species, since one net sweep can miss animals entirely.
- Return every animal to the water it came from as soon as it has been counted.
- Results: tabulate the mean number of each species against site, and expect stonefly and mayfly nymphs upstream with bloodworms and sludgeworms dominating downstream.
- Maths: count the number of different species at each site to compare biodiversity, and calculate the percentage fall in dissolved oxygen with upstream−downstreamupstream×100\dfrac{\text{upstream}-\text{downstream}}{\text{upstream}}\times100upstreamupstream−downstream×100.
- Watch out: a different depth, flow rate or stream bed at the two sites changes the catch for reasons unconnected with pollution, and disturbing the gravel for longer at one site inflates that count.
- Safety: work in pairs on a firm bank well away from deep or fast water, cover any cut with a waterproof plaster, wear gloves and wash hands thoroughly afterwards because stream water can carry pathogens.
Toxins build up along food chains
Bioaccumulation
Bioaccumulation is the build-up of a substance in the body of an organism because it is taken in faster than it is broken down or excreted.
Biomagnification
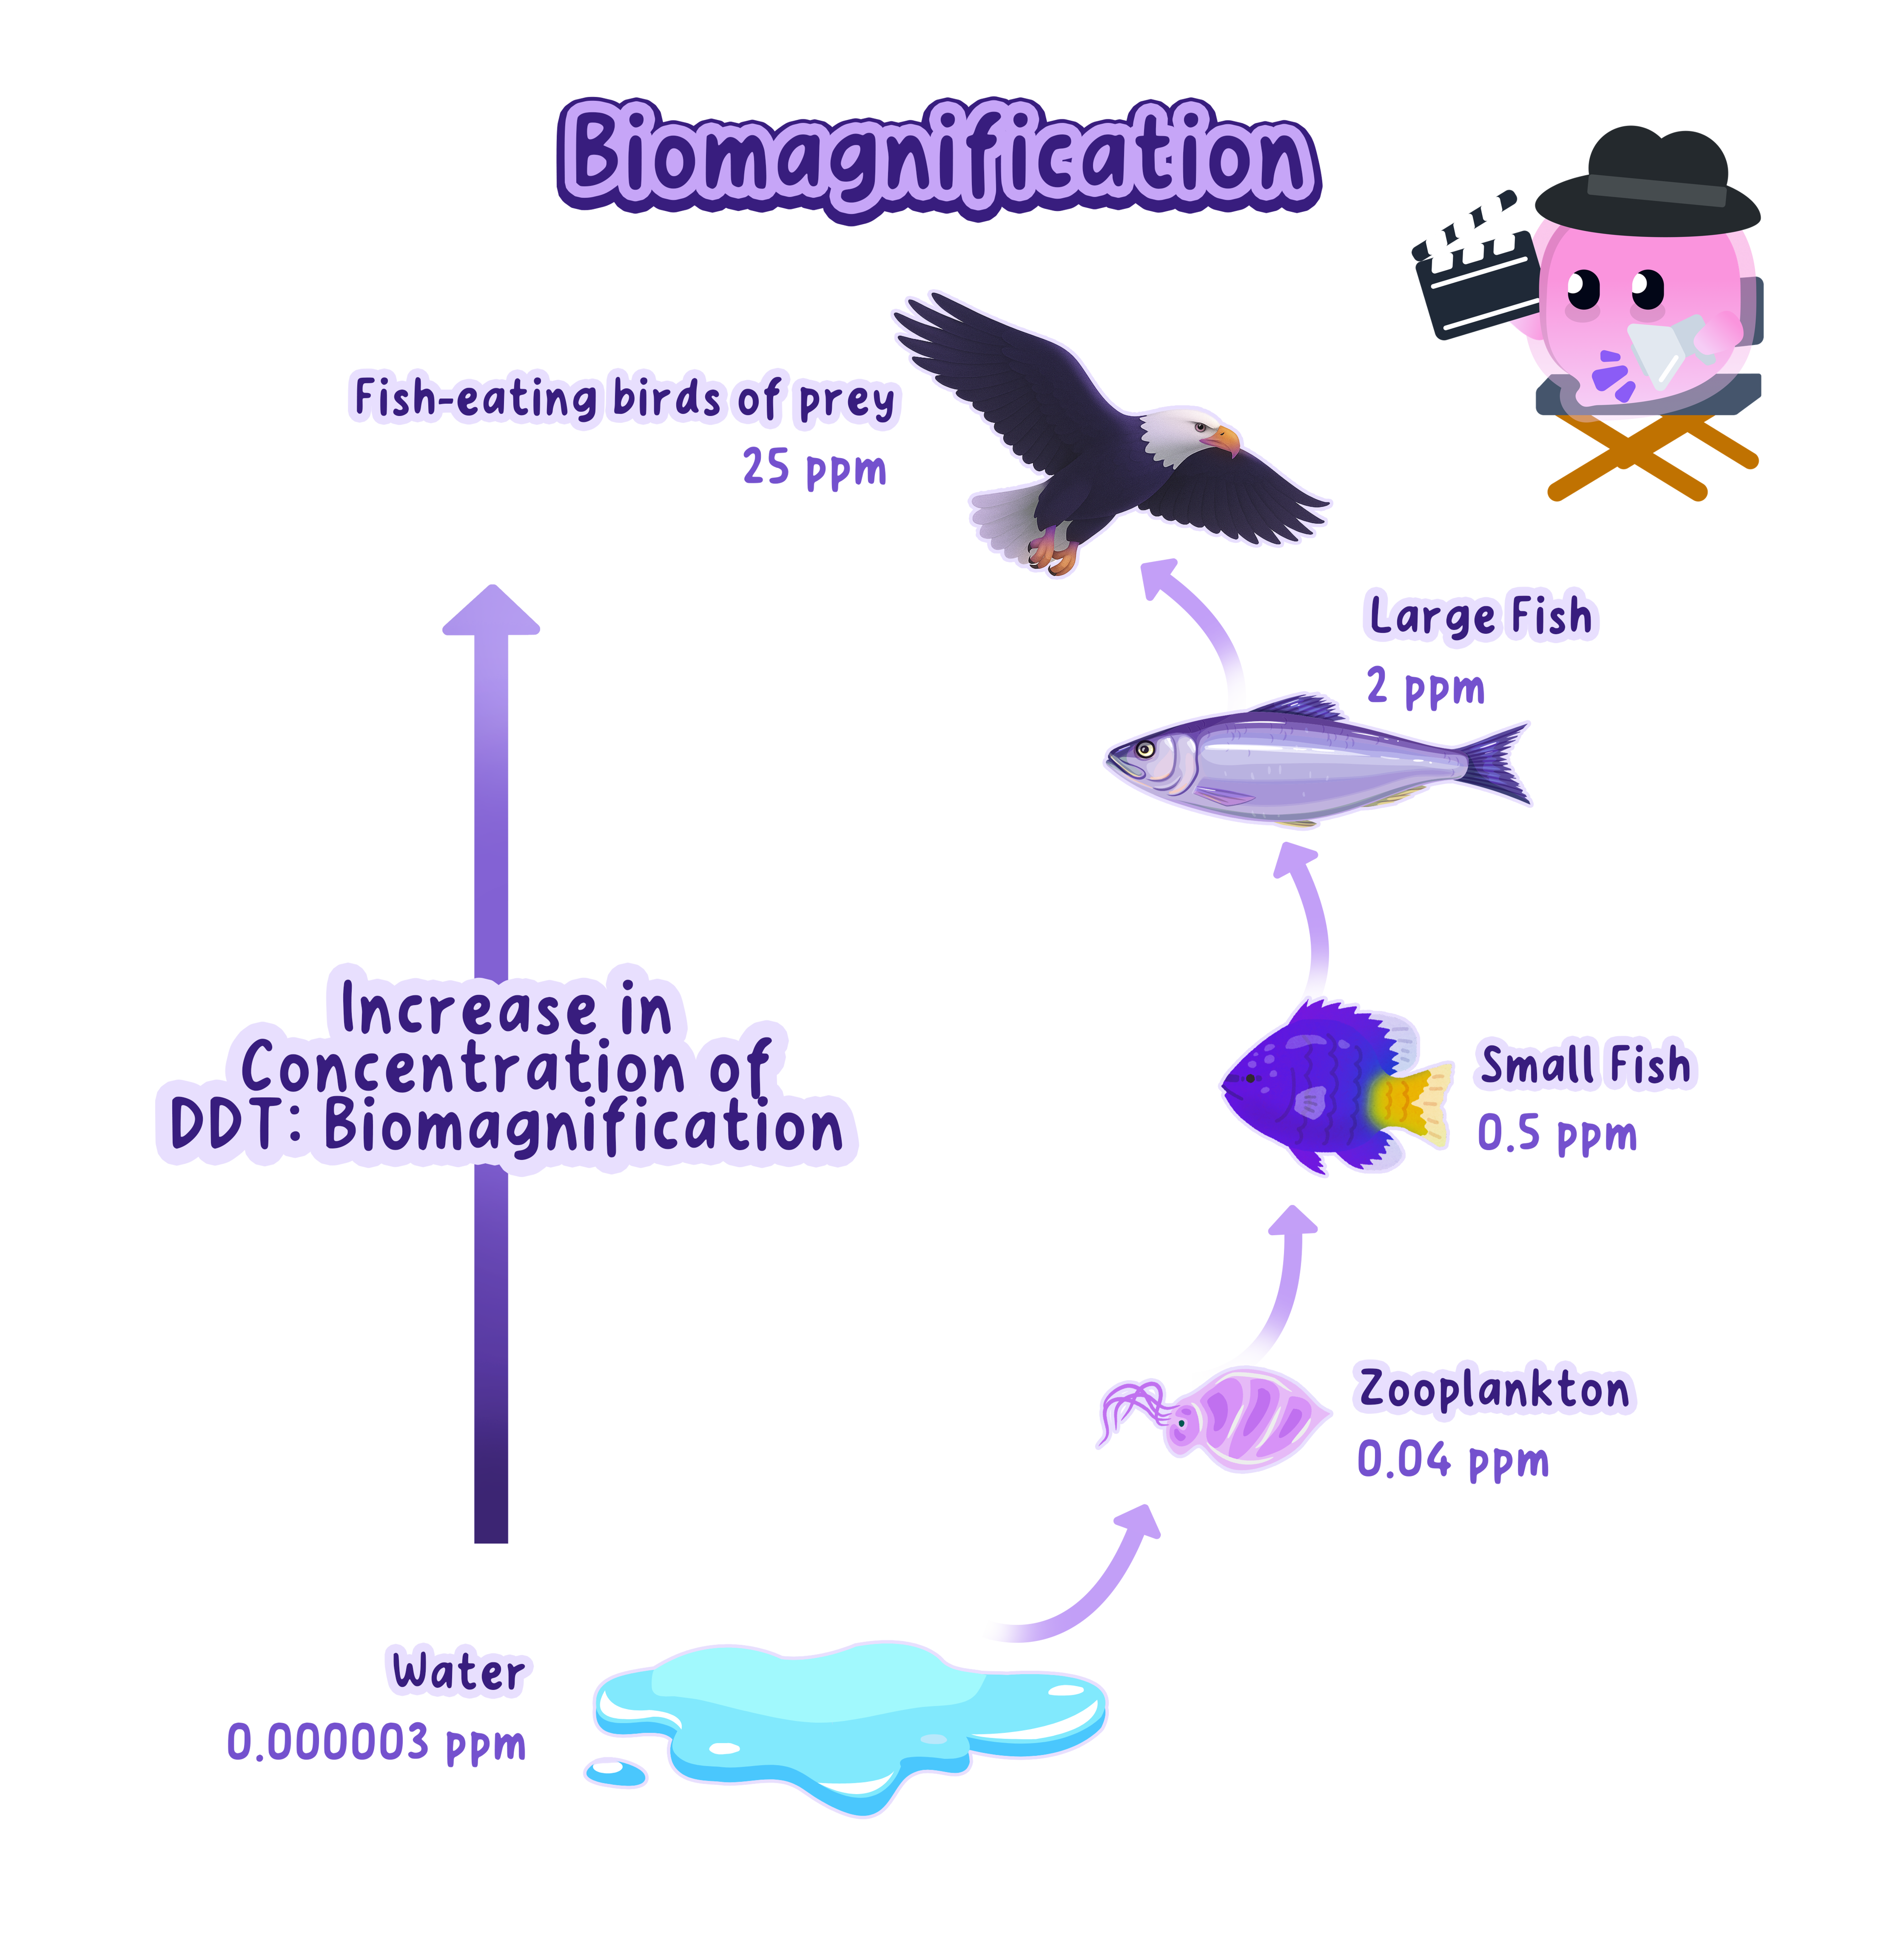
Biomagnification is the increase in the concentration of a substance in the bodies of organisms at each successive trophic level of a food chain.
- Some pollutants, such as the pesticide DDT and the heavy metal mercury, are absorbed by producers and small organisms at very low concentrations.
- These substances are not broken down by enzymes and are not excreted, so they are stored in the body, usually in fatty tissue.
- The amount inside one organism therefore rises steadily throughout its life, which is bioaccumulation.
- A consumer has to eat many prey organisms to survive, and it takes in the stored toxin from every one of them.
- The concentration in its body therefore ends up higher than the concentration in any single prey animal, and the same happens again at the next level up, which is biomagnification.
- The top predator carries the highest concentration of all, which is why birds of prey and large fish are harmed first even though the water around them appears almost clean.
- DDT reached concentrations in birds of prey that thinned their eggshells, so the eggs broke under the weight of the incubating parent and few chicks hatched.
- Populations of peregrine falcons and sparrowhawks fell sharply as a result, and recovered after DDT was banned in Britain.
- Concentrations of this kind are quoted in parts per million, written ppm\text{ppm}ppm, where 1 ppm1\ \text{ppm}1 ppm is one gram of the substance in one million grams of tissue.
Working out how far a pollutant is magnified
- In a lake, DDT is measured at 0.000003 ppm0.000003\ \text{ppm}0.000003 ppm in the water and at 25 ppm25\ \text{ppm}25 ppm in fish-eating birds.
- The number of times the concentration has been magnified is 250.000003\dfrac{25}{0.000003}0.00000325.
- This works out as roughly 8 300 0008\,300\,0008300000 times, written in standard form as 8.3×1068.3\times10^{6}8.3×10⁶.
- A concentration that is harmless in the water is therefore lethal by the time it reaches the top of the chain.
Effects spread through the food web
Food web
A food web is a set of interconnected food chains showing all the feeding relationships in a community.
Interdependence
Interdependence is the reliance of organisms on other organisms in their community for resources or processes needed for survival and reproduction.
- Because the species in a community are interdependent, damage done to one species passes outwards through the food web to species that were never touched directly.
- When a species is removed, its predators lose a food source, so their numbers fall unless they can switch to alternative prey.
- At the same time the organisms it used to eat are no longer being eaten, so their numbers rise.
- Those organisms then eat more of their own food source, and the disturbance carries on down the web in this alternating pattern.
- A species with many links in the web has the widest effect, so removing a plant eaten by twenty insect species matters more than removing one with a single specialist feeder.
- Losing a pollinating insect also removes the plants that depended on it for reproduction, so the damage crosses from animals to plants.
Overfishing one species of fish leaves its predators short of food while the plankton it grazed on increases, so a single fishing decision changes numbers at three levels of the web.
Conserving species and habitats
Conservation
Conservation is the protection and management of species and habitats so that biodiversity is maintained.
Seed bank
A seed bank is a collection of stored seeds kept viable to conserve plant species and their genetic diversity.
- Conservation works at two scales: protecting one species that is close to extinction, and protecting a whole habitat so that every species in it survives together.
- A breeding programme keeps an endangered species in a zoo or wildlife park and breeds it in captivity, away from the predators, poachers and habitat loss that reduced it in the wild.
- Records of how every individual is related, kept in a studbook shared between zoos, are used to choose which animals are paired, and individuals are moved between zoos so that close relatives never breed together.
- Artificial insemination places sperm collected from a male directly into a female, so two animals in different countries can breed without either being moved.
- In vitro fertilisation joins an egg and a sperm outside the body and the embryo is then implanted into a female, which produces more offspring from a rare pair than natural mating would.
- Animals bred in captivity are released back into protected habitat once numbers are high enough, which is called reintroduction.
- Reintroduction only succeeds if the habitat still exists and the released animals can find food and avoid predators, so captive-bred animals are often trained to hunt before release.
- Plants are conserved in the same way by seed banks, which store dried seeds at low temperature so they stay alive for decades and can be grown again if the wild plants are lost.
- Botanic gardens grow rare species directly and hold living collections alongside the stored seed.
- Whole habitats are protected as nature reserves, national parks and marine protected areas, where building, ploughing and hunting are restricted by law.
- Damaged habitats are rebuilt by replanting native trees, replanting hedgerows, restoring drained peat bogs and leaving wide uncut margins around arable fields.
- Legal controls limit the damage directly, through bans on hunting protected species, fishing quotas that cap the mass landed each year, and rules setting a minimum net mesh size so young fish escape.
- Reducing what is released matters just as much, through recycling, treating sewage before it is discharged, removing sulfur from fuels and fitting catalytic converters to vehicles.
Answering questions on human impact
- Finish the chain of reasoning rather than stopping at the activity, so write that deforestation removes nest sites and food, which reduces the number of species living there.
- Name a real organism wherever one is available, such as a stonefly nymph or a bushy lichen, because a named indicator scores where the word insect does not.
- When a question asks for both positive and negative interactions, give both, since half the marks sit on the side most answers leave out.
- Read biomagnification data from the top of the chain down, and quote the two concentrations with their units when describing the trend.
- Give three ways that human land use reduces the biodiversity of an area.
- Describe the six steps of eutrophication, from fertiliser on a field to dead fish in a lake.
- Explain why lichens are used as indicators of air quality.
- State one advantage and one disadvantage of using a living indicator species rather than a meter.
- Explain why the concentration of a pesticide is highest in a top predator.
- Describe two ways a breeding programme keeps genetic variation high in a captive population.
6.1.3 Maintaining biodiversity
What maintaining biodiversity means
Biodiversity
Biodiversity is the variety of living organisms, including variation within species and the range of species and ecosystems.
Conservation
Conservation is the protection and management of species and habitats so that biodiversity is maintained.
- Maintaining biodiversity means keeping the range of different species in an area, not simply keeping the total number of organisms high.
- Local biodiversity is the variety of species in one habitat, such as a pond, a hedgerow or a stretch of moorland.
- Global biodiversity is the variety of species across the whole planet, and a species lost globally can never be replaced.
- A species can disappear locally while still surviving elsewhere, so local losses are often reversible by restoring the habitat and bringing the species back.
- Conservation decisions weigh the benefits of keeping biodiversity against the cost of the scheme and against what the land, water or animals would otherwise be used for.
A conservation scheme has to be judged on evidence rather than intention, which means measuring whether the populations it protects actually recover.
Benefits for the ecosystem
Ecosystem services
Ecosystem services are the benefits people obtain from natural ecosystems, such as pollination, fertile soil and clean water.
- Species in a community depend on one another for food, shelter, pollination and the recycling of nutrients, so the community only works while all of those roles are filled.
- A community with high biodiversity is more stable, because a predator that loses one prey species can switch to another and the disturbance is absorbed.
- A community with few species has few alternatives, so the loss of one species can cause several others to disappear with it.
- Insect pollinators such as bees and hoverflies are needed for the reproduction of most flowering plants, so their loss would remove the plants that many other species feed on.
- Decomposers break down dead material and release mineral ions back into the soil, and without them nutrients would stay locked in dead bodies rather than returning to plants.
- Plant roots bind soil particles together, which slows erosion, while woodland and peat soak up rainfall and reduce flooding downstream.
- Photosynthesis by forests, grassland and marine algae removes carbon dioxide from the atmosphere and releases oxygen, so vegetation regulates the composition of the air.
- Predators and parasites keep the numbers of potential pests down, which reduces how much pesticide a farmer has to use.
Benefits for people
- Every crop and farm animal was bred from a wild species, so wild populations are the original source of the food supply.
- Wild relatives of crops still carry alleles for disease resistance, drought tolerance and higher yield that modern varieties have lost, and plant breeders cross those alleles back in.
- A species that becomes extinct takes those alleles with it, so the raw material for future crop breeding shrinks every time one is lost.
- Many medicines were first isolated from wild organisms, including aspirin from willow bark, digitalis from the foxglove and penicillin from a mould.
- Only a small fraction of species has ever been tested for useful compounds, so an unstudied species may hold a future drug that is lost if it becomes extinct.
- Wild species also supply raw materials such as timber, fibres, dyes and rubber.
- Fishing, forestry, farming and tourism all depend on healthy ecosystems, so biodiversity supports jobs and income directly.
- People also value wild places for walking, watching wildlife and study, which is harder to price but is one reason nature reserves attract public funding.
A wild relative rescuing a crop
- Commercial potato varieties are grown as monocultures, so every plant in a field carries the same alleles and the same weakness to disease.
- Wild potato species growing in South America carry alleles giving resistance to blight, the fungus-like organism that destroyed the Irish potato crop in the 1840s.
- Breeders cross the wild plant with the commercial variety and then select the offspring that keep the high yield and gain the resistance.
- That cross is only possible while the wild species still exists, which is the practical argument for conserving plants nobody eats.
Small populations are hard to rescue
Gene pool
A gene pool is all of the alleles present in a population.
Genetic variation
Genetic variation is the difference in DNA sequences between individuals of the same species.
Inbreeding
Inbreeding is breeding between closely related individuals.
- A population that has fallen to a few dozen individuals carries only the alleles those individuals happen to have, so its gene pool is small.
- Every mating in such a population is between close relatives, which is inbreeding.
- Close relatives carry the same alleles, so their offspring are far more likely to inherit two copies of a harmful recessive allele and show the condition it causes.
- Inbred populations therefore tend to have lower fertility, more offspring that die young and more inherited disorders, which pushes the numbers down further.
- Low genetic variation also removes the raw material for natural selection, because selection can only act on differences that already exist.
- If a new disease arrives, few individuals are likely to carry an allele for resistance, so a single outbreak can remove the whole population.
- The same is true of a change in conditions such as a hotter, drier summer, so a species with little variation is less able to adapt over generations.
- Conservation therefore aims to keep populations large and connected, because a large connected population holds more alleles than several small isolated ones of the same total size.
- Do not say that low genetic variation makes the animals unhealthy at present.
- It means the population is less likely to contain an individual that can survive a future disease or a change in conditions.
- Write the answer in terms of alleles and survival, not in terms of animals being weak.
Challenges of conservation schemes
- Conservation costs money, and wardens, fencing, vehicles, veterinary care and survey work all have to be paid for every year rather than once.
- Protected land cannot be used for housing, farming, logging or mining, so protecting a habitat always means giving up the income that use would have produced.
- Local people may depend on that land for food, fuel or work, so a scheme that ignores them takes away a livelihood and is resisted.
- Schemes therefore work best when local communities are employed by them and gain an income from the protected habitat, so that protecting it is worth more to them than clearing it.
- Poaching continues wherever the price paid for ivory, horn or skins is high and the chance of being caught is low.
- Reserves are often huge and remote, so patrolling every boundary is expensive and in practice incomplete.
- Populations recover over decades while funding is usually granted for a few years, so a scheme can be stopped before anyone can tell whether it worked.
- Protecting one species can also conflict with protecting another, for example when a growing population of a protected grazing animal strips the vegetation that other species depend on.
Reaching international agreement
- Migrating animals, river pollution and changes in the atmosphere all cross national borders, so a country acting alone cannot protect the species that move through it.
- Trade in endangered species is international as well, so a hunting ban in one country achieves little while the market in another country still pays for the product.
- Countries hold different priorities, and a nation trying to lift its population out of poverty may see a restriction on logging or fishing as blocking development that wealthier nations already had.
- International agreements are usually voluntary, so there is no court that can force a government to keep to a target it has signed.
- Negotiations take years because every country has to agree, and a government that changes can withdraw from what the previous one signed.
- Agreements are more likely to hold when wealthier countries pay towards the cost, share technology and fund the monitoring, so the burden does not fall on the poorest nations alone.
A worldwide ban on trading a product, such as the ban on selling ivory, cuts the price poachers can get and so reduces the reward for killing the animal in the first place.
Monitoring whether a scheme works
- A count taken before the scheme starts, called the baseline, is essential, because without it there is nothing for later counts to be compared against.
- The same sampling method is then repeated at the same sites and at the same time of year, so that a change in the figures reflects the population and not a change in technique.
- Plant and slow-moving species are counted by sampling, mobile animals are estimated by marking and recapturing, and both give an estimate with a margin of uncertainty rather than an exact figure.
- Satellite images measure how much forest cover remains, and camera traps, leg rings and radio tags record which individuals are still alive and where they travel.
- Monitoring is difficult when a species is rare, nocturnal, shy or spread thinly over a vast area, which is exactly the situation for most endangered species.
- Numbers also change for reasons unconnected with the scheme, such as a hard winter or an outbreak of disease, so several years of data are needed before a trend can be claimed.
- Genetic testing of samples adds a second measure, showing whether the number of different alleles in the population is being maintained as well as the number of individuals.
Ecotourism
Ecotourism
Ecotourism is tourism that is managed so that visitors can see wildlife while the habitat is conserved and local people benefit.
- Ecotourism is managed so that the habitat survives the visit, using small groups, local guides, marked paths and hides, temporary accommodation and waste carried away from the site.
- The entrance fees and permits pay directly for wardens, fencing, vehicles and research, so the habitat funds its own protection.
- Local people are employed as guides, drivers and staff, which gives a community a reliable income that depends on the wildlife staying alive.
- A living animal watched by paying visitors year after year is then worth more than the single payment a poacher would receive, which changes the incentive.
- Visitors who have seen a species close up are also more likely to support conservation once they are home.
- Ecotourism still has costs, because flights and vehicles release carbon dioxide and the journey may do more damage than the visit prevents.
- Too many visitors trample vegetation, erode paths, leave litter and disturb animals that are feeding or breeding, so numbers have to be capped and sensitive areas closed in the breeding season.
- The money can also leave the area entirely if the tours are run by companies based elsewhere, in which case local people gain nothing and the incentive disappears.
Paying to watch ospreys in Scotland
- Ospreys returned to Scotland after being hunted out of Britain, and their nests were at risk from egg collectors.
- Reserves built hides and cameras so that visitors pay to watch a nest without going near it.
- The entrance money pays for wardens who guard the nests through the breeding season and for the surveys that track the population.
- Cafes, campsites and shops nearby gain trade from the visitors, so the local economy benefits from the birds being there.
- Viewing is kept to fixed hides at a set distance, because a crowd walking to the nest itself would drive the birds off the eggs.
Answering benefits and challenges questions
- Give a biological benefit and an economic benefit when a question asks why biodiversity should be maintained, because answers that only mention animals being nice to look at score nothing.
- Say who bears the cost when writing about a challenge, since the marks sit on the conflict between conservation and the people who need that land or that catch.
- For a question worth four or more marks, give points on both sides and then state a judgement, because the final mark is usually for the conclusion.
- Use the figures printed in the question when one is given, quoting the population before and after the scheme rather than writing that numbers went up.
- Explain why a community with high biodiversity is more stable than one with few species.
- Give two benefits people gain from maintaining biodiversity, one of them medical.
- Explain why a small population is at greater risk when a new disease appears.
- Give two reasons why it is difficult to get countries to agree on a conservation scheme.
- Describe two difficulties in monitoring whether a conservation scheme has worked.
- State one benefit and one drawback of ecotourism.
6.1.4 Environmental change and distribution of organisms
Environmental change and where species can live
Environmental change
Environmental change is a change in the physical or chemical conditions of a habitat over time.
Distribution
Distribution is the pattern of where a species is found across a habitat.
Abiotic factor
An abiotic factor is a non-living physical or chemical feature of the environment that affects organisms.
- Every species survives only within a range of values of each abiotic factor, such as temperature, rainfall, dissolved oxygen or pH, and it grows best somewhere near the middle of that range.
- The distribution of a species is therefore a map of the places where all of those conditions happen to be met at once.
- When conditions change, those suitable places move, shrink or disappear, so the distribution of the species changes with them.
- A population facing change has three possible outcomes: it moves to somewhere the conditions still suit it, it adapts over many generations by natural selection, or it dies out in that area.
- Environmental change is not always caused by people, because volcanic eruptions, changes in the Earth's orbit and natural cycles in the oceans have all shifted conditions in the past.
- What matters for distribution is the rate as well as the size of the change, because a change that takes thousands of years allows species to move and adapt, while one that takes decades does not.
A species disappearing from one area has not necessarily become extinct, because it may still be living wherever the conditions it needs have moved to.
Changes in water availability
- Water is needed by plants for photosynthesis, for transporting mineral ions and for keeping cells turgid, so the water in the soil sets a hard limit on where a plant species can grow.
- Lower or less predictable rainfall means plants lose more water by transpiration than the roots can take up, so they wilt, stop growing and eventually die.
- Losing the plants removes the producers at the base of the food chain, so the animals that fed on them decline even though the drought did not kill them directly.
- Ponds and wetlands that dry out early in the summer remove the standing water that frogs, toads and newts need for their eggs and tadpoles, so breeding fails for that year.
- Lower river flow leaves shallower, slower water that warms up faster, and warmer water holds less dissolved oxygen.
- Species needing well oxygenated water, such as trout and stonefly nymphs, are pushed upstream into cooler, faster stretches, and disappear from the lower river altogether.
- Rising sea level floods coastal marshes and mudflats, and salt water pushing inland kills freshwater plants that cannot tolerate it.
- Coastal habitats would normally shift inland as the sea rises, but sea walls and buildings block that retreat, so the habitat is squeezed out between the two.
- Melting sea ice removes the frozen platform that polar bears hunt seals from, so the bears are forced ashore for longer each year and feed less.
- Heavier, more concentrated rainfall causes the opposite problem, because flooding waterlogs soil, drives the air out of the spaces between the particles and suffocates plant roots.
A rise in water temperature and a fall in dissolved oxygen arrive together, so a single change in the weather alters two abiotic factors at the same time.
Changes in atmospheric gases
Greenhouse gas
A greenhouse gas is an atmospheric gas that absorbs infrared radiation and keeps the Earth warmer than it would otherwise be.
Ocean acidification
Ocean acidification is the fall in the pH of seawater caused by carbon dioxide dissolving in it.
- Carbon dioxide is released by burning fossil fuels in power stations, vehicles and industry, and by cutting and burning forests.
- Deforestation raises the concentration twice over, because the carbon stored in the wood is released and the trees that were absorbing carbon dioxide for photosynthesis are gone.
- Methane is released by cattle and sheep during digestion, from flooded rice fields and from decaying waste in landfill sites.
- Both gases are greenhouse gases, which means they absorb the infrared radiation given off by the warmed surface of the Earth instead of letting it escape into space.
- Some of that energy is radiated back towards the surface, so a higher concentration of greenhouse gases raises the mean surface temperature of the Earth.
- A higher mean temperature shifts the belts of climate towards the poles, changes rainfall patterns and lengthens the growing season in temperate regions.
- Around a quarter of the carbon dioxide released dissolves in the oceans, where it forms a weak acid and lowers the pH of the water, which is ocean acidification.
- Lower pH reduces the carbonate available in seawater, so corals, molluscs and shelled plankton build their shells and skeletons more slowly and existing shells dissolve more easily.
- Shelled plankton sit at the base of marine food chains, so a fall in their numbers reduces the food available to every species above them.
- Warmer water also causes coral bleaching, because the coral expels the photosynthetic algae living inside it and then loses the sugars those algae supplied.
- A bleached reef supports far fewer fish and invertebrates, so the loss of one species removes the habitat that a whole community depended on.
How distributions are shifting
- As temperatures rise, the band of climate a species can tolerate moves towards the poles and up hillsides, and many species have been recorded moving with it.
- Species that disperse easily move first, which is why flying insects and birds show the clearest shifts while slow-spreading plants lag behind.
- Butterflies such as the comma have spread north across Britain, and the little egret, once a rare visitor, now breeds in southern England.
- Species already at the top of a mountain, at the edge of a coast or on an island have nowhere suitable left to move to, so their range shrinks until it disappears.
- Roads, cities and farmland also block the route, so a species may fail to reach suitable conditions that now exist only a short distance away.
- Warmer springs change the timing of events as well as their location, so leaves open, insects emerge and birds lay eggs earlier than they did fifty years ago.
- Problems arise when two linked species shift by different amounts, for example when caterpillars reach their peak before the chicks that feed on them have hatched.
- Some migratory birds now travel shorter distances or stay all year, because the winter conditions they used to escape from no longer occur.
- Warmer conditions also extend the range of species that carry disease, so mosquitoes carrying malaria can survive at higher altitudes and further from the equator than before.
- Do not write that a species adapts to a change within its own lifetime.
- An individual either survives the new conditions or it does not, and adaptation happens across generations as the individuals with useful alleles survive and reproduce.
The evidence scientists collect
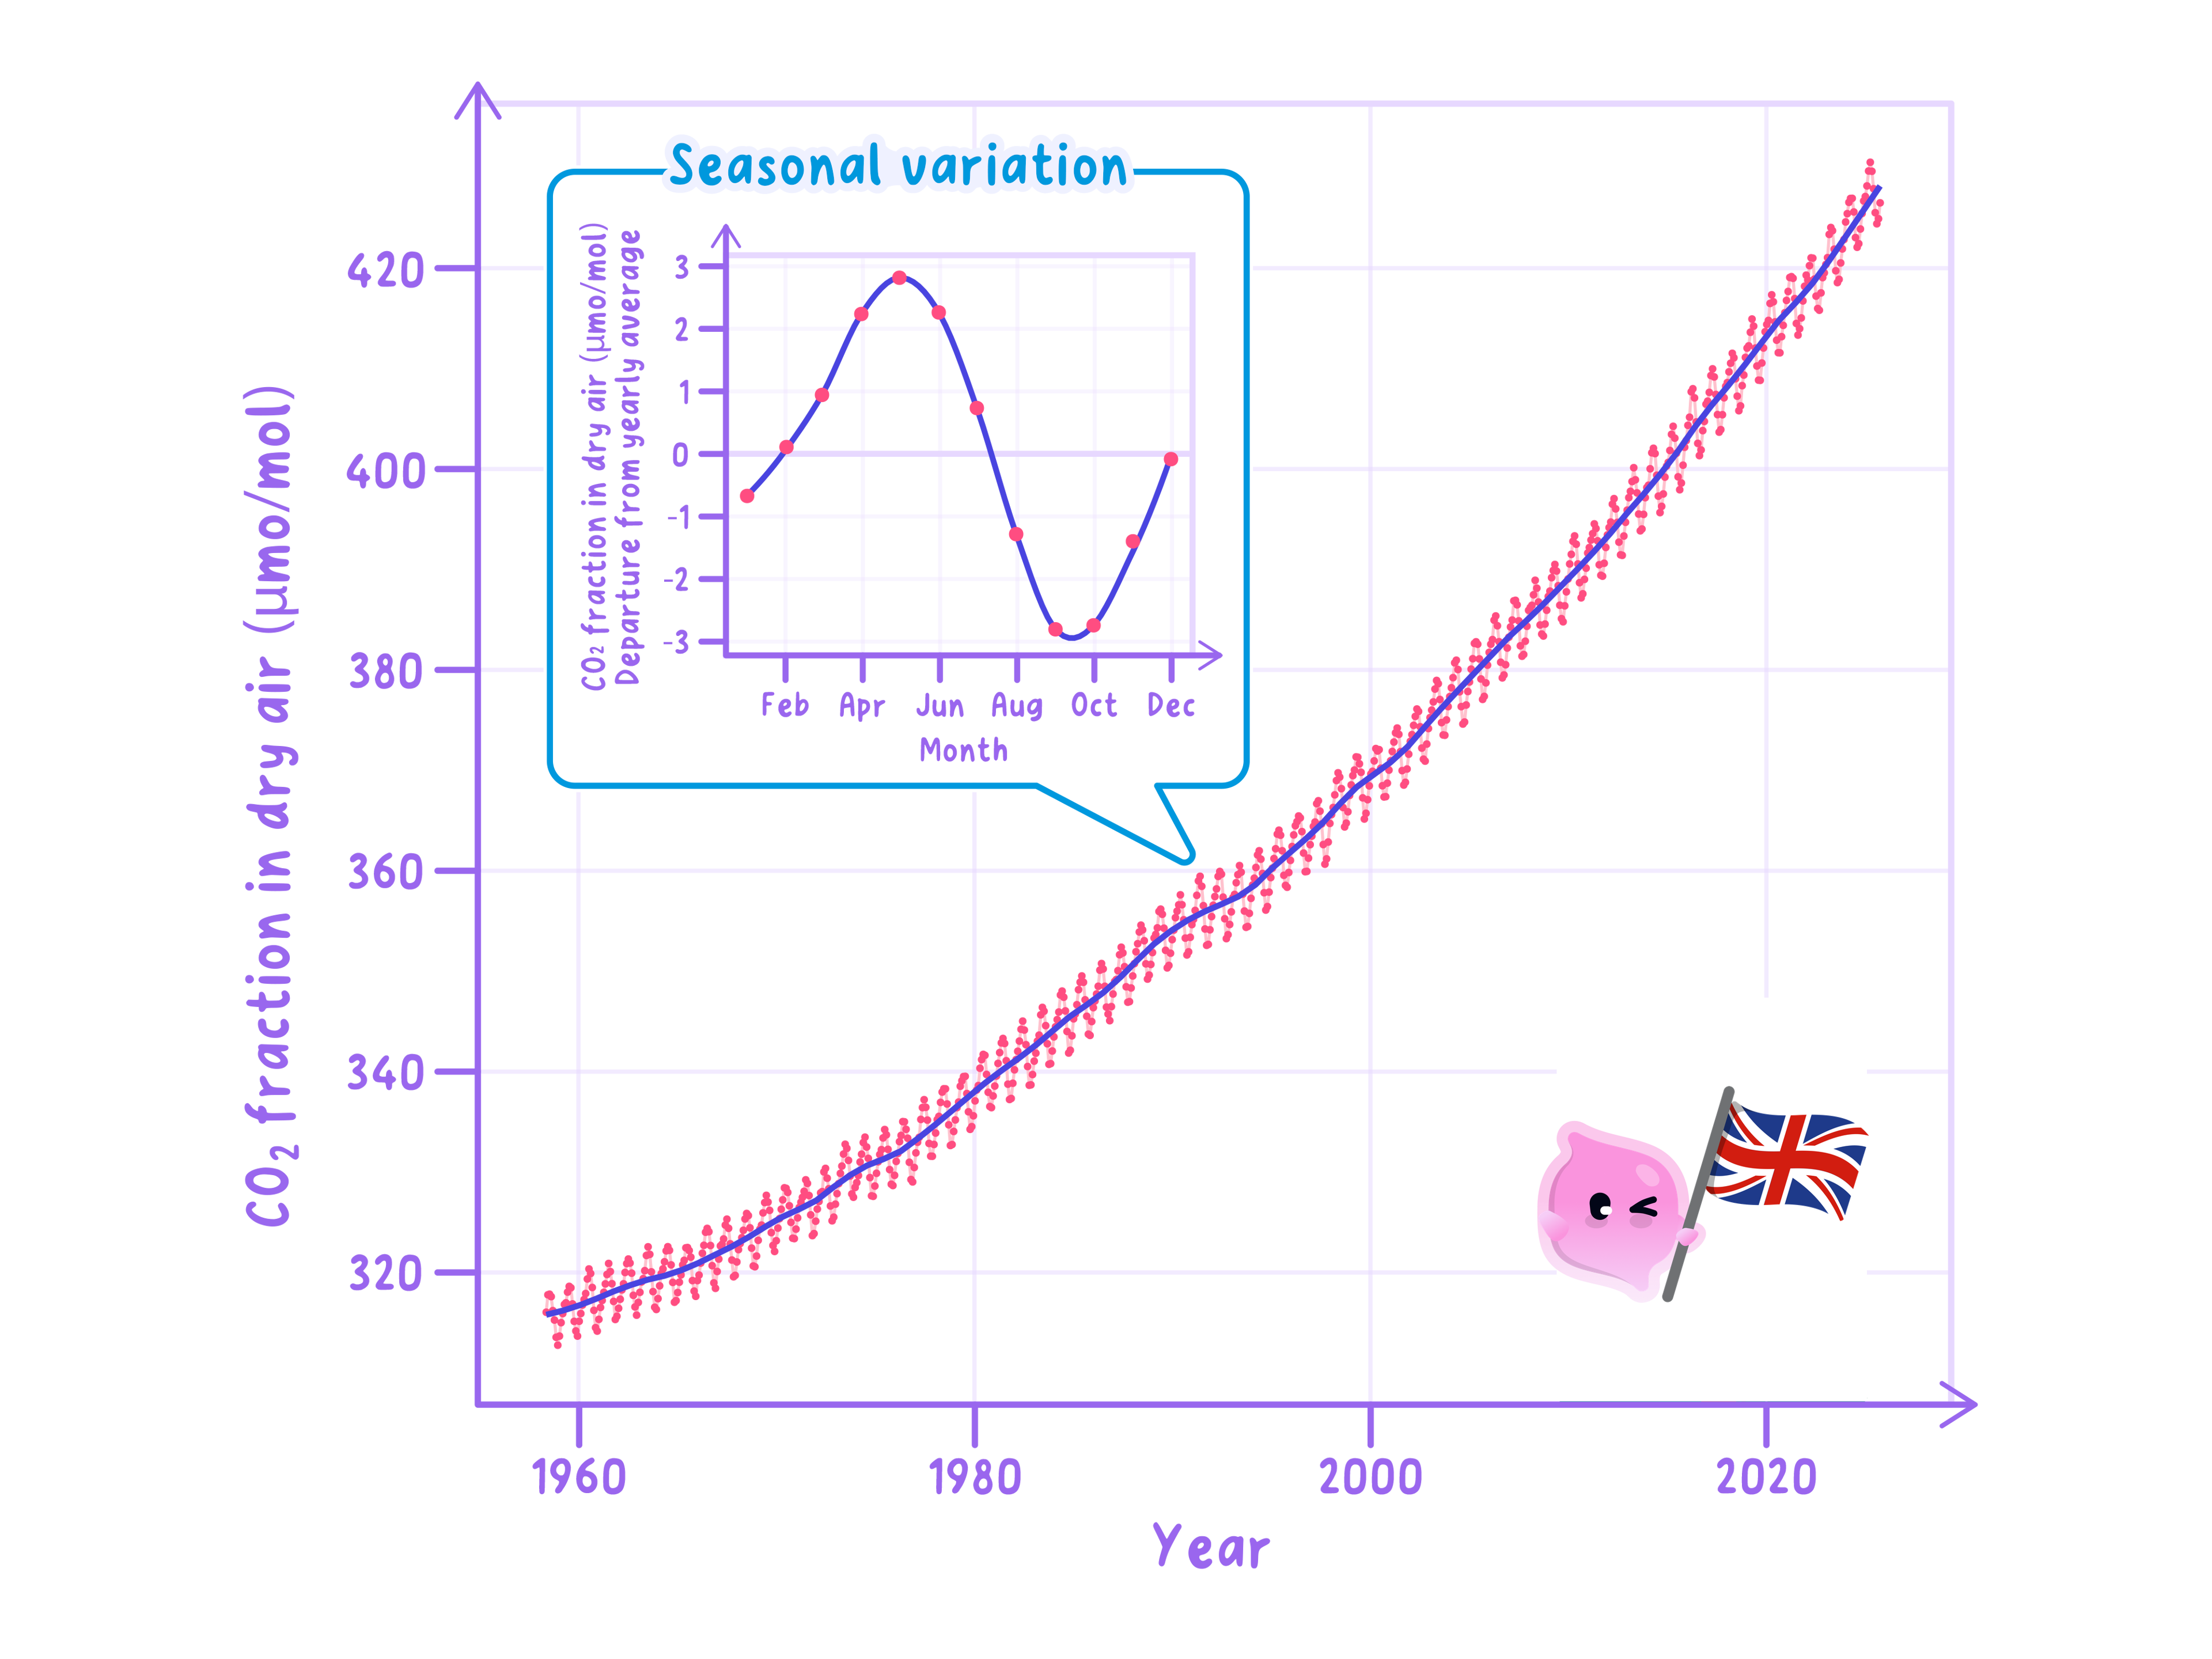
- Carbon dioxide has been measured directly and continuously at Mauna Loa in Hawaii since 1958, giving an unbroken record from a site far from any city or factory.
- That record rises from about 315 ppm315\ \text{ppm}315 ppm at the start to over 420 ppm420\ \text{ppm}420 ppm today, where ppm\text{ppm}ppm means parts per million.
- The record also zigzags within each year, because photosynthesis across the northern hemisphere removes carbon dioxide each summer and respiration and decay return it each winter.
- That seasonal zigzag matters when the data are read, because a rise between two months proves nothing on its own and only the trend across many years does.
- For the period before direct measurements, air trapped as bubbles in ice cores is analysed, and because the ice forms in annual layers the samples can be dated by depth.
- Ice cores extend the record back hundreds of thousands of years and show that the present concentration is higher than at any point in that time.
- Temperature is recorded by weather stations on land, by instruments on ships and buoys, and by satellites, and the readings are combined into a mean global temperature.
- Satellites also measure the area of sea ice and the height of the sea surface, while tide gauges around coasts give a much longer record of sea level.
- Distribution itself is measured by repeated national surveys, in which volunteers record which species are found in each grid square so that maps made decades apart can be compared.
- Long-running recording schemes also log the date of the first frogspawn, the first swallow and the first flowering of a plant, which is how shifts in timing are detected.
- Bird ringing and satellite tagging follow individual animals, showing where they travel and whether those routes are changing.
- Pollen grains preserved in peat and lake mud identify which plants grew at a site in the past, so past distributions can be reconstructed and compared with today.
- Dissolved oxygen meters, pH probes and nitrate tests give the matching evidence for water, and repeated readings at fixed sites show how those values are changing.
Evaluating the evidence
Correlation
A correlation is a relationship in which two variables change together, which on its own does not show that one causes the other.
- Two sets of data rising together show a correlation, and a correlation alone does not establish that one is causing the other.
- A causal link is only accepted when a mechanism can also be explained, which for greenhouse gases is the absorption of infrared radiation.
- Distributions change for several reasons at once, so habitat loss, pollution, disease and introduced species have to be considered before a shift is attributed to climate.
- A long record is essential because conditions vary naturally from year to year, and a few unusual years can look like a trend when they are not.
- Evidence is stronger when the method has stayed the same throughout, when the instruments are calibrated, and when readings are taken at many sites rather than one.
- Independent datasets collected by different teams using different methods that reach the same conclusion are stronger still, because an error in one would not appear in the others.
- Results are checked by other scientists before publication, and that peer review is what separates a tested conclusion from an untested claim.
- Evidence from ice cores, pollen and tree rings is indirect, so it is less precise than a direct reading and the dates carry a margin of error.
- Records from the past are patchy and uneven, with far more data from Europe and North America than from the oceans, the tropics or the poles.
- The number of volunteers recording wildlife has grown, so more sightings of a species may mean more people looking rather than more organisms present.
- Computer models predict what will happen next, and a prediction is a calculation from assumptions rather than a measurement, so it is tested by checking it against what has already been observed.
Describing a carbon dioxide record with figures
- A record gives the mean carbon dioxide concentration as 317 ppm317\ \text{ppm}317 ppm in 1960 and 414 ppm414\ \text{ppm}414 ppm in 2020.
- Increase in concentration: 414−317=97 ppm414-317=97\ \text{ppm}414−317=97 ppm.
- Percentage increase: 97317×100=30.6%\dfrac{97}{317}\times100=30.6\%31797×100=30.6%, which rounds to 31%31\%31%.
- Mean rate of increase: 9760=1.6 ppm\dfrac{97}{60}=1.6\ \text{ppm}6097=1.6 ppm per year.
- The trend is upward throughout, and the small rise and fall within each year is the seasonal pattern rather than a change in the trend.
Answering evaluate the evidence questions
- Quote figures from the graph or table with their units and the years they come from, because a described trend with no numbers rarely gets past the first mark.
- Say what the evidence does support, then give one clear limitation, since an answer that only criticises the data scores as poorly as one that only accepts it.
- Name a specific alternative cause rather than writing that other factors might be involved, for example habitat loss from new housing.
- Use the word correlation when two sets of data change together, and only claim a cause once you have given the mechanism behind it.
- Finish with a judgement when the question says evaluate, stating how far the evidence supports the conclusion and why.
- Give the three possible outcomes for a population when the conditions in its habitat change.
- Explain how a fall in river flow reduces the number of stonefly nymphs in a stream.
- Describe how a rise in atmospheric carbon dioxide raises the mean surface temperature of the Earth.
- Explain why ocean acidification is a problem for corals and shelled plankton.
- State two sources of evidence for how atmospheric carbon dioxide has changed over time.
- Give two reasons why a correlation between temperature and the range of a species does not prove that the temperature caused the change.
