Question 14
HScientists studied the distribution of one species of butterfly in Great Britain.
They recorded how far north the butterfly was found, its northern limit, in different years.
The Figure shows the northern limit of the butterfly in 1970, 1990 and 2010.
Figure
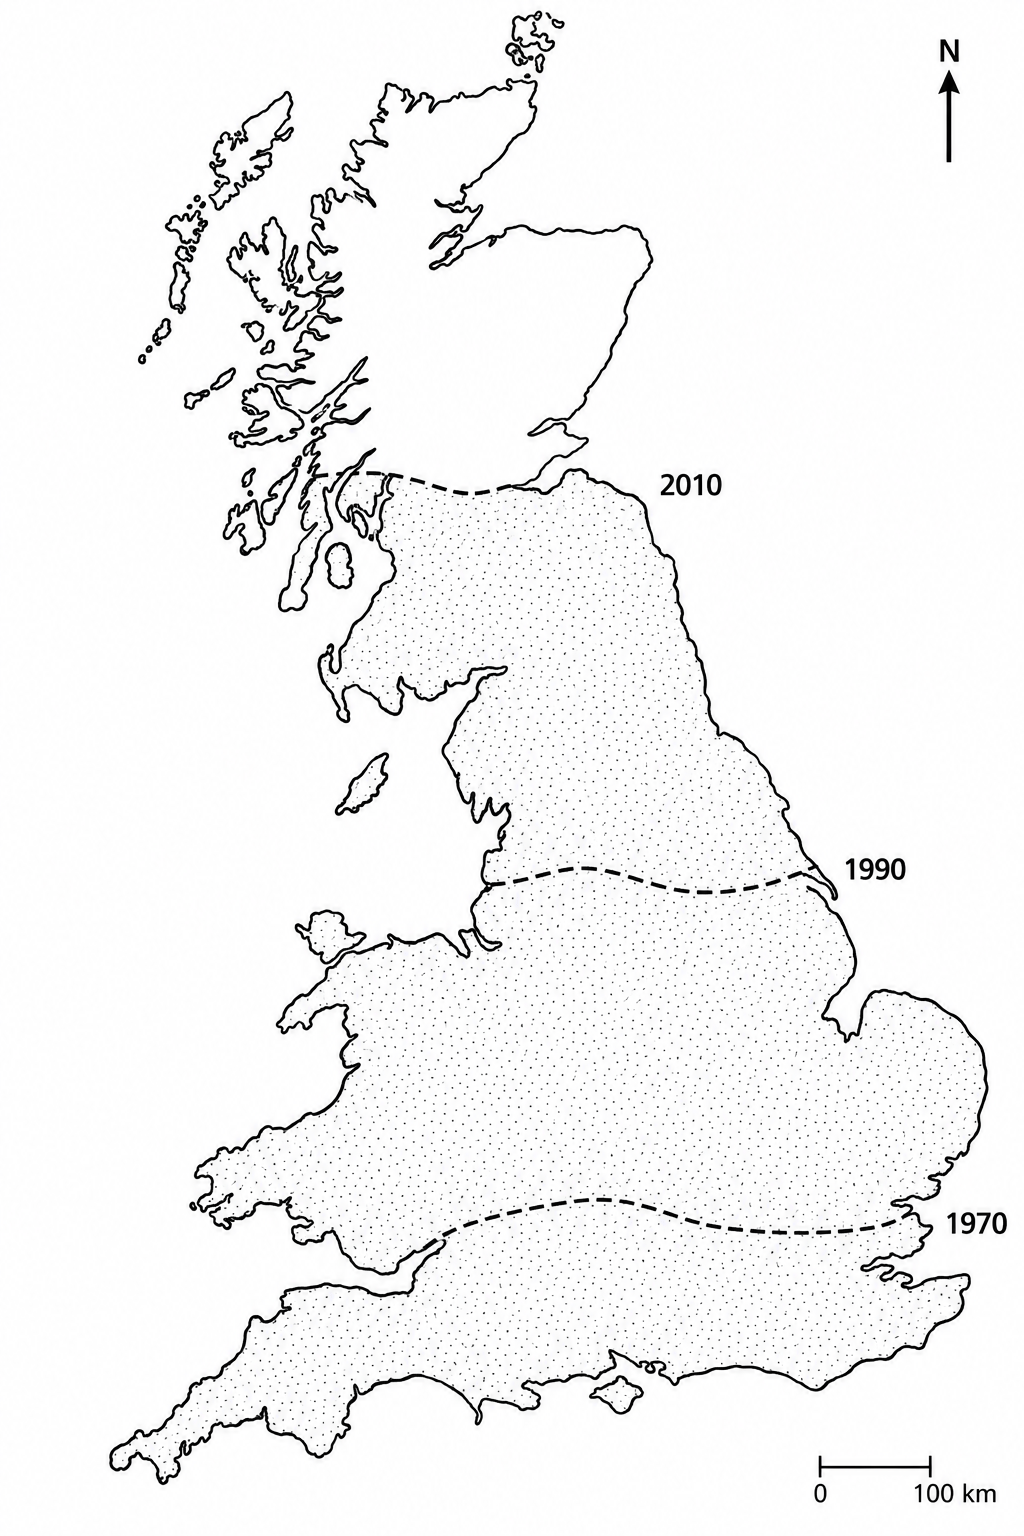
The Table shows the distance of the northern limit from the south coast, the mean annual temperature in Great Britain and the concentration of carbon dioxide in the atmosphere.
Table
| Year | Distance of northern limit from south coast in km\text{km}km | Mean annual temperature in ∘C^\circ\text{C}∘C | Carbon dioxide concentration in parts per million |
|---|---|---|---|
| 1970 | 300 | 9.2 | 325 |
| 1990 | 420 | 9.6 | 354 |
| 2010 | 560 | 9.9 | 389 |
a.[2]
Calculate the mean rate at which the northern limit moved north between 1970 and 2010.
Give your answer in km\text{km}km per year.
b.[3]
Explain how an increase in the concentration of carbon dioxide in the atmosphere could cause the butterfly to be found further north.
c.[3]
Evaluate the evidence that the increase in carbon dioxide concentration caused the change in the distribution of the butterfly.
6.1 Monitoring and maintaining the environment Questions
109 exam-style questions on OCR GCSE Biology 6.1 Monitoring and maintaining the environment, covering 6.1.1 Field investigation of distribution and abundance, 6.1.2 Human interactions and biodiversity, 6.1.3 Maintaining biodiversity, and 6.1.4 Environmental change and distribution of organisms. Each one has a worked solution and a mark scheme showing where the marks go.