Environmental change and where species can live
Environmental change
Environmental change is a change in the physical or chemical conditions of a habitat over time.
Distribution
Distribution is the pattern of where a species is found across a habitat.
Abiotic factor
An abiotic factor is a non-living physical or chemical feature of the environment that affects organisms.
- Every species survives only within a range of values of each abiotic factor, such as temperature, rainfall, dissolved oxygen or pH, and it grows best somewhere near the middle of that range.
- The distribution of a species is therefore a map of the places where all of those conditions happen to be met at once.
- When conditions change, those suitable places move, shrink or disappear, so the distribution of the species changes with them.
- A population facing change has three possible outcomes: it moves to somewhere the conditions still suit it, it adapts over many generations by natural selection, or it dies out in that area.
- Environmental change is not always caused by people, because volcanic eruptions, changes in the Earth's orbit and natural cycles in the oceans have all shifted conditions in the past.
- What matters for distribution is the rate as well as the size of the change, because a change that takes thousands of years allows species to move and adapt, while one that takes decades does not.
A species disappearing from one area has not necessarily become extinct, because it may still be living wherever the conditions it needs have moved to.
Changes in water availability
- Water is needed by plants for photosynthesis, for transporting mineral ions and for keeping cells turgid, so the water in the soil sets a hard limit on where a plant species can grow.
- Lower or less predictable rainfall means plants lose more water by transpiration than the roots can take up, so they wilt, stop growing and eventually die.
- Losing the plants removes the producers at the base of the food chain, so the animals that fed on them decline even though the drought did not kill them directly.
- Ponds and wetlands that dry out early in the summer remove the standing water that frogs, toads and newts need for their eggs and tadpoles, so breeding fails for that year.
- Lower river flow leaves shallower, slower water that warms up faster, and warmer water holds less dissolved oxygen.
- Species needing well oxygenated water, such as trout and stonefly nymphs, are pushed upstream into cooler, faster stretches, and disappear from the lower river altogether.
- Rising sea level floods coastal marshes and mudflats, and salt water pushing inland kills freshwater plants that cannot tolerate it.
- Coastal habitats would normally shift inland as the sea rises, but sea walls and buildings block that retreat, so the habitat is squeezed out between the two.
- Melting sea ice removes the frozen platform that polar bears hunt seals from, so the bears are forced ashore for longer each year and feed less.
- Heavier, more concentrated rainfall causes the opposite problem, because flooding waterlogs soil, drives the air out of the spaces between the particles and suffocates plant roots.
A rise in water temperature and a fall in dissolved oxygen arrive together, so a single change in the weather alters two abiotic factors at the same time.
Changes in atmospheric gases
Greenhouse gas
A greenhouse gas is an atmospheric gas that absorbs infrared radiation and keeps the Earth warmer than it would otherwise be.
Ocean acidification
Ocean acidification is the fall in the pH of seawater caused by carbon dioxide dissolving in it.
- Carbon dioxide is released by burning fossil fuels in power stations, vehicles and industry, and by cutting and burning forests.
- Deforestation raises the concentration twice over, because the carbon stored in the wood is released and the trees that were absorbing carbon dioxide for photosynthesis are gone.
- Methane is released by cattle and sheep during digestion, from flooded rice fields and from decaying waste in landfill sites.
- Both gases are greenhouse gases, which means they absorb the infrared radiation given off by the warmed surface of the Earth instead of letting it escape into space.
- Some of that energy is radiated back towards the surface, so a higher concentration of greenhouse gases raises the mean surface temperature of the Earth.
- A higher mean temperature shifts the belts of climate towards the poles, changes rainfall patterns and lengthens the growing season in temperate regions.
- Around a quarter of the carbon dioxide released dissolves in the oceans, where it forms a weak acid and lowers the pH of the water, which is ocean acidification.
- Lower pH reduces the carbonate available in seawater, so corals, molluscs and shelled plankton build their shells and skeletons more slowly and existing shells dissolve more easily.
- Shelled plankton sit at the base of marine food chains, so a fall in their numbers reduces the food available to every species above them.
- Warmer water also causes coral bleaching, because the coral expels the photosynthetic algae living inside it and then loses the sugars those algae supplied.
- A bleached reef supports far fewer fish and invertebrates, so the loss of one species removes the habitat that a whole community depended on.
How distributions are shifting
- As temperatures rise, the band of climate a species can tolerate moves towards the poles and up hillsides, and many species have been recorded moving with it.
- Species that disperse easily move first, which is why flying insects and birds show the clearest shifts while slow-spreading plants lag behind.
- Butterflies such as the comma have spread north across Britain, and the little egret, once a rare visitor, now breeds in southern England.
- Species already at the top of a mountain, at the edge of a coast or on an island have nowhere suitable left to move to, so their range shrinks until it disappears.
- Roads, cities and farmland also block the route, so a species may fail to reach suitable conditions that now exist only a short distance away.
- Warmer springs change the timing of events as well as their location, so leaves open, insects emerge and birds lay eggs earlier than they did fifty years ago.
- Problems arise when two linked species shift by different amounts, for example when caterpillars reach their peak before the chicks that feed on them have hatched.
- Some migratory birds now travel shorter distances or stay all year, because the winter conditions they used to escape from no longer occur.
- Warmer conditions also extend the range of species that carry disease, so mosquitoes carrying malaria can survive at higher altitudes and further from the equator than before.
- Do not write that a species adapts to a change within its own lifetime.
- An individual either survives the new conditions or it does not, and adaptation happens across generations as the individuals with useful alleles survive and reproduce.
The evidence scientists collect
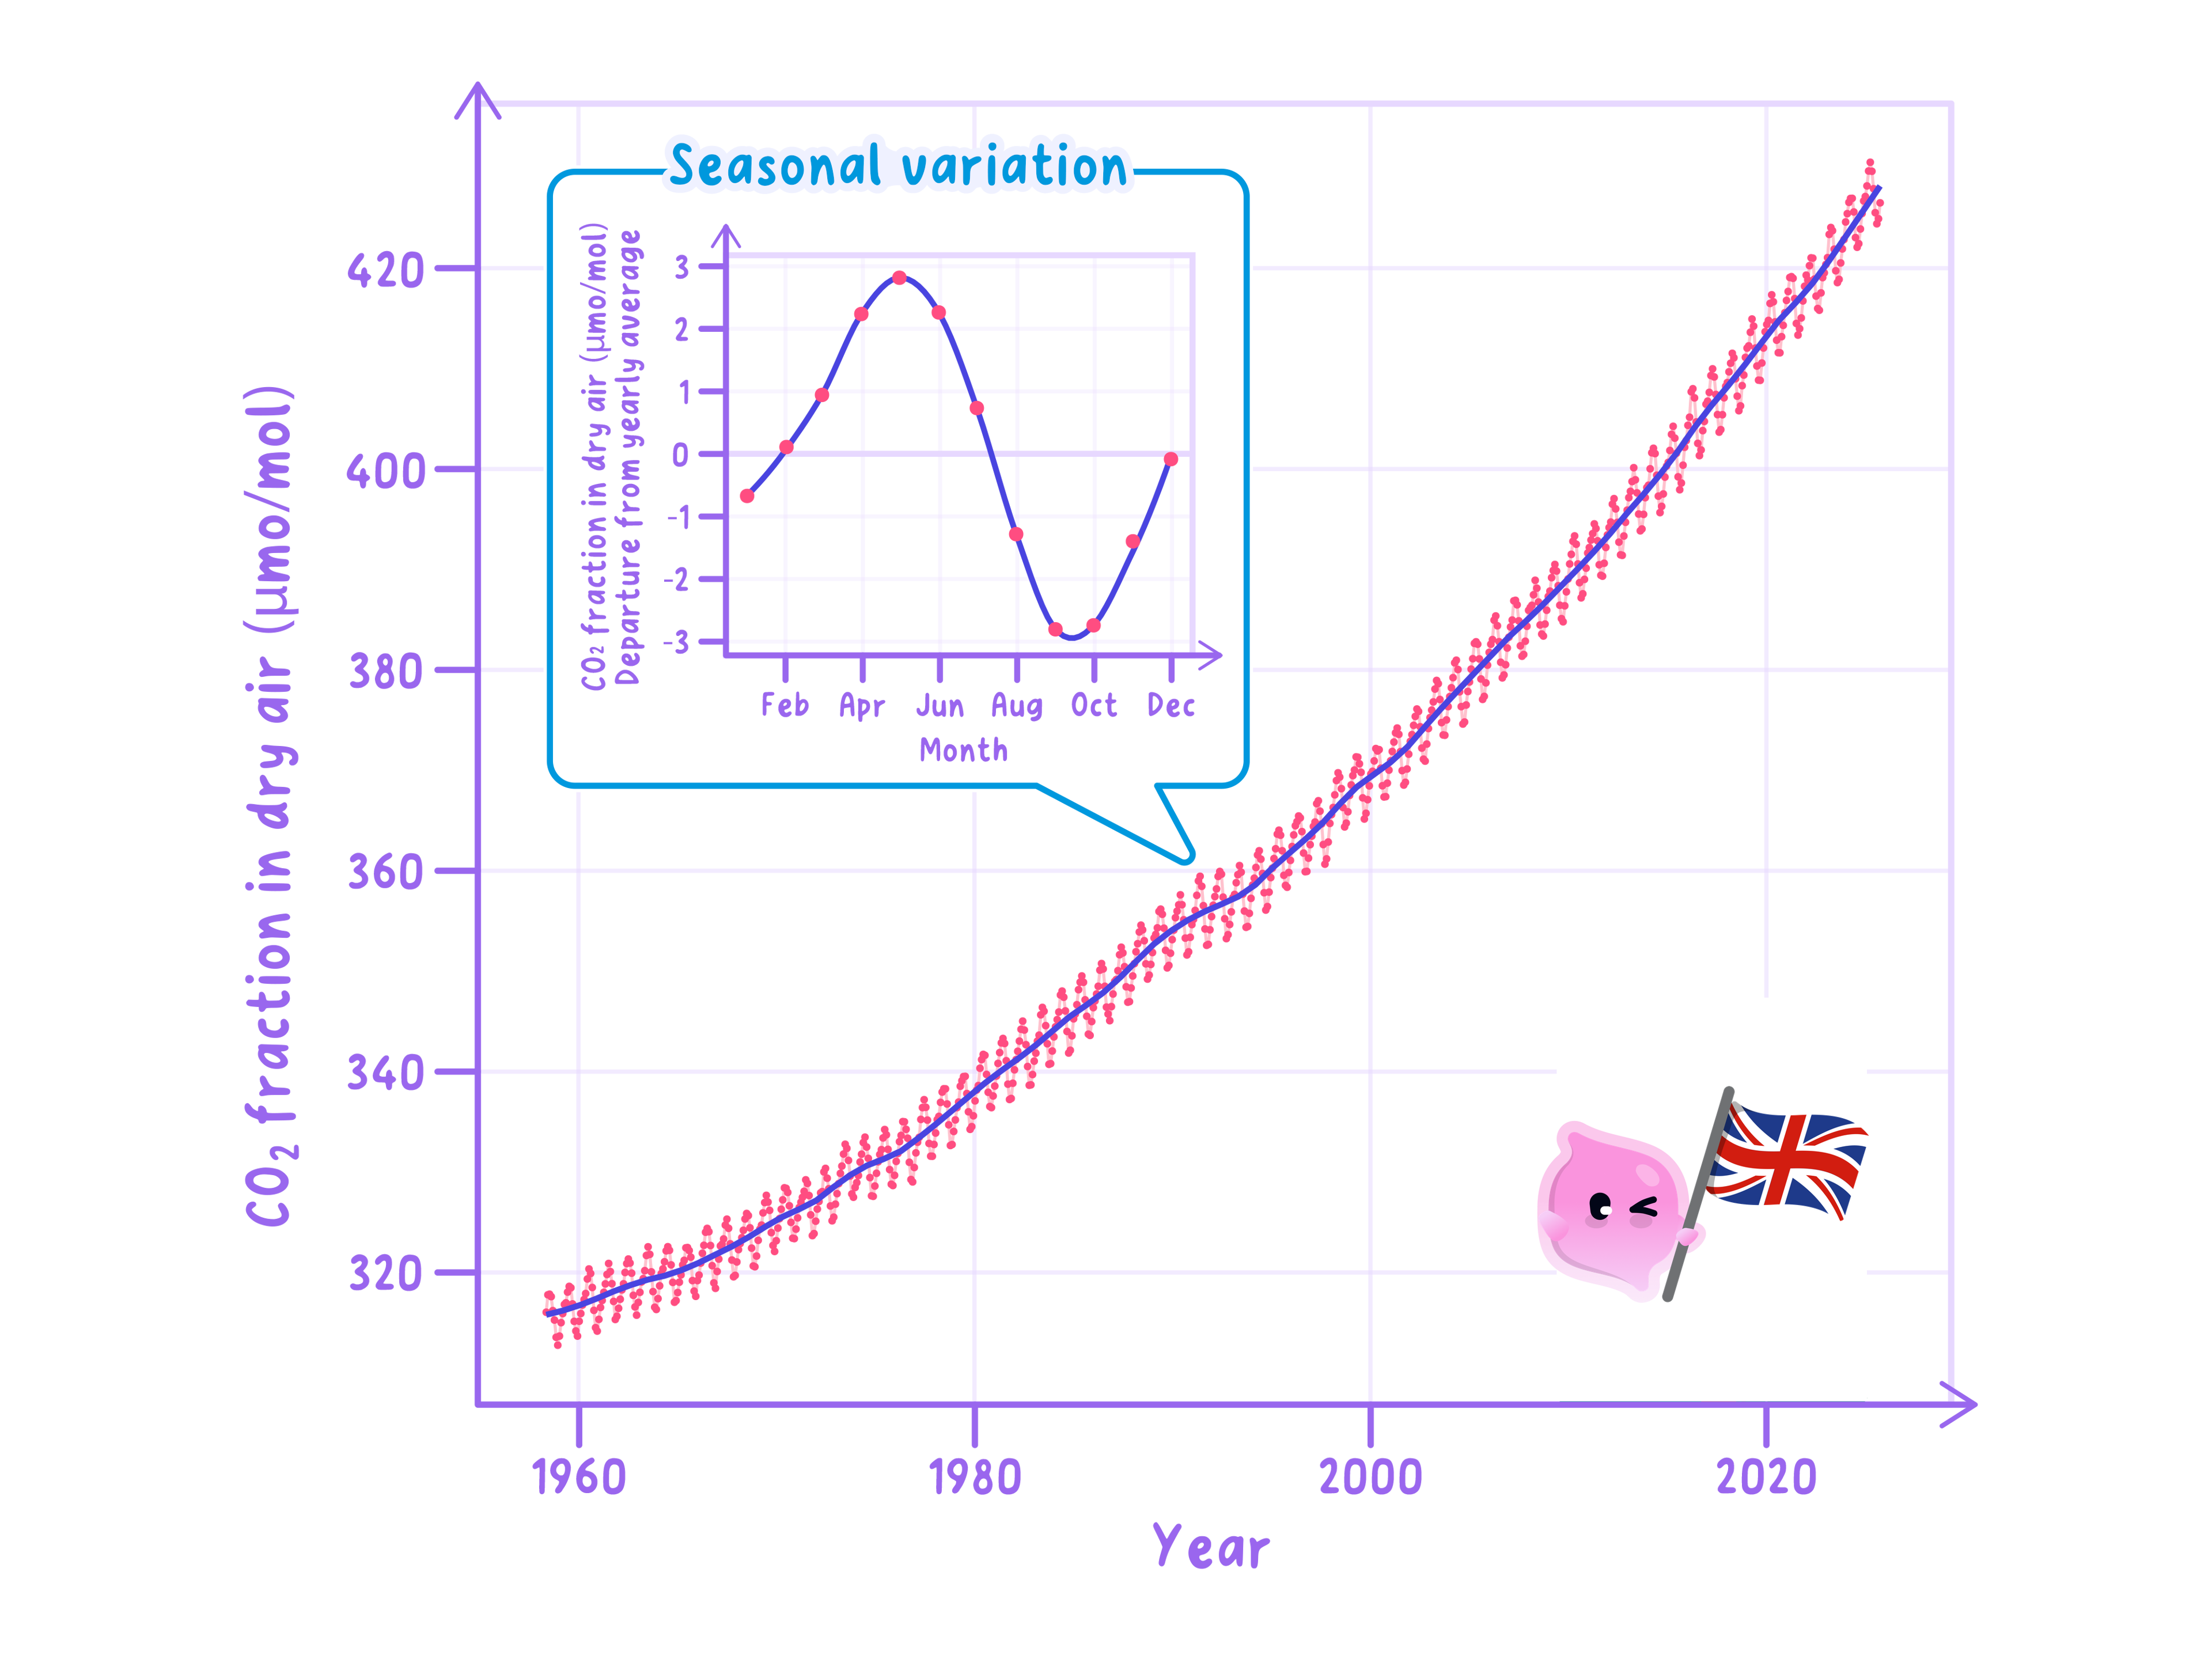
- Carbon dioxide has been measured directly and continuously at Mauna Loa in Hawaii since 1958, giving an unbroken record from a site far from any city or factory.
- That record rises from about 315 ppm315\ \text{ppm}315 ppm at the start to over 420 ppm420\ \text{ppm}420 ppm today, where ppm\text{ppm}ppm means parts per million.
- The record also zigzags within each year, because photosynthesis across the northern hemisphere removes carbon dioxide each summer and respiration and decay return it each winter.
- That seasonal zigzag matters when the data are read, because a rise between two months proves nothing on its own and only the trend across many years does.
- For the period before direct measurements, air trapped as bubbles in ice cores is analysed, and because the ice forms in annual layers the samples can be dated by depth.
- Ice cores extend the record back hundreds of thousands of years and show that the present concentration is higher than at any point in that time.
- Temperature is recorded by weather stations on land, by instruments on ships and buoys, and by satellites, and the readings are combined into a mean global temperature.
- Satellites also measure the area of sea ice and the height of the sea surface, while tide gauges around coasts give a much longer record of sea level.
- Distribution itself is measured by repeated national surveys, in which volunteers record which species are found in each grid square so that maps made decades apart can be compared.
- Long-running recording schemes also log the date of the first frogspawn, the first swallow and the first flowering of a plant, which is how shifts in timing are detected.
- Bird ringing and satellite tagging follow individual animals, showing where they travel and whether those routes are changing.
- Pollen grains preserved in peat and lake mud identify which plants grew at a site in the past, so past distributions can be reconstructed and compared with today.
- Dissolved oxygen meters, pH probes and nitrate tests give the matching evidence for water, and repeated readings at fixed sites show how those values are changing.
Evaluating the evidence
Correlation
A correlation is a relationship in which two variables change together, which on its own does not show that one causes the other.
- Two sets of data rising together show a correlation, and a correlation alone does not establish that one is causing the other.
- A causal link is only accepted when a mechanism can also be explained, which for greenhouse gases is the absorption of infrared radiation.
- Distributions change for several reasons at once, so habitat loss, pollution, disease and introduced species have to be considered before a shift is attributed to climate.
- A long record is essential because conditions vary naturally from year to year, and a few unusual years can look like a trend when they are not.
- Evidence is stronger when the method has stayed the same throughout, when the instruments are calibrated, and when readings are taken at many sites rather than one.
- Independent datasets collected by different teams using different methods that reach the same conclusion are stronger still, because an error in one would not appear in the others.
- Results are checked by other scientists before publication, and that peer review is what separates a tested conclusion from an untested claim.
- Evidence from ice cores, pollen and tree rings is indirect, so it is less precise than a direct reading and the dates carry a margin of error.
- Records from the past are patchy and uneven, with far more data from Europe and North America than from the oceans, the tropics or the poles.
- The number of volunteers recording wildlife has grown, so more sightings of a species may mean more people looking rather than more organisms present.
- Computer models predict what will happen next, and a prediction is a calculation from assumptions rather than a measurement, so it is tested by checking it against what has already been observed.
Describing a carbon dioxide record with figures
- A record gives the mean carbon dioxide concentration as 317 ppm317\ \text{ppm}317 ppm in 1960 and 414 ppm414\ \text{ppm}414 ppm in 2020.
- Increase in concentration: 414−317=97 ppm414-317=97\ \text{ppm}414−317=97 ppm.
- Percentage increase: 97317×100=30.6%\dfrac{97}{317}\times100=30.6\%31797×100=30.6%, which rounds to 31%31\%31%.
- Mean rate of increase: 9760=1.6 ppm\dfrac{97}{60}=1.6\ \text{ppm}6097=1.6 ppm per year.
- The trend is upward throughout, and the small rise and fall within each year is the seasonal pattern rather than a change in the trend.
Answering evaluate the evidence questions
- Quote figures from the graph or table with their units and the years they come from, because a described trend with no numbers rarely gets past the first mark.
- Say what the evidence does support, then give one clear limitation, since an answer that only criticises the data scores as poorly as one that only accepts it.
- Name a specific alternative cause rather than writing that other factors might be involved, for example habitat loss from new housing.
- Use the word correlation when two sets of data change together, and only claim a cause once you have given the mechanism behind it.
- Finish with a judgement when the question says evaluate, stating how far the evidence supports the conclusion and why.
- Give the three possible outcomes for a population when the conditions in its habitat change.
- Explain how a fall in river flow reduces the number of stonefly nymphs in a stream.
- Describe how a rise in atmospheric carbon dioxide raises the mean surface temperature of the Earth.
- Explain why ocean acidification is a problem for corals and shelled plankton.
- State two sources of evidence for how atmospheric carbon dioxide has changed over time.
- Give two reasons why a correlation between temperature and the range of a species does not prove that the temperature caused the change.
