9.2.1 Energy transfer between trophic levels
Energy is lost between trophic levels
Trophic level
The feeding position of an organism in a food chain, food web or ecological pyramid, numbered from level 1 at the producer.
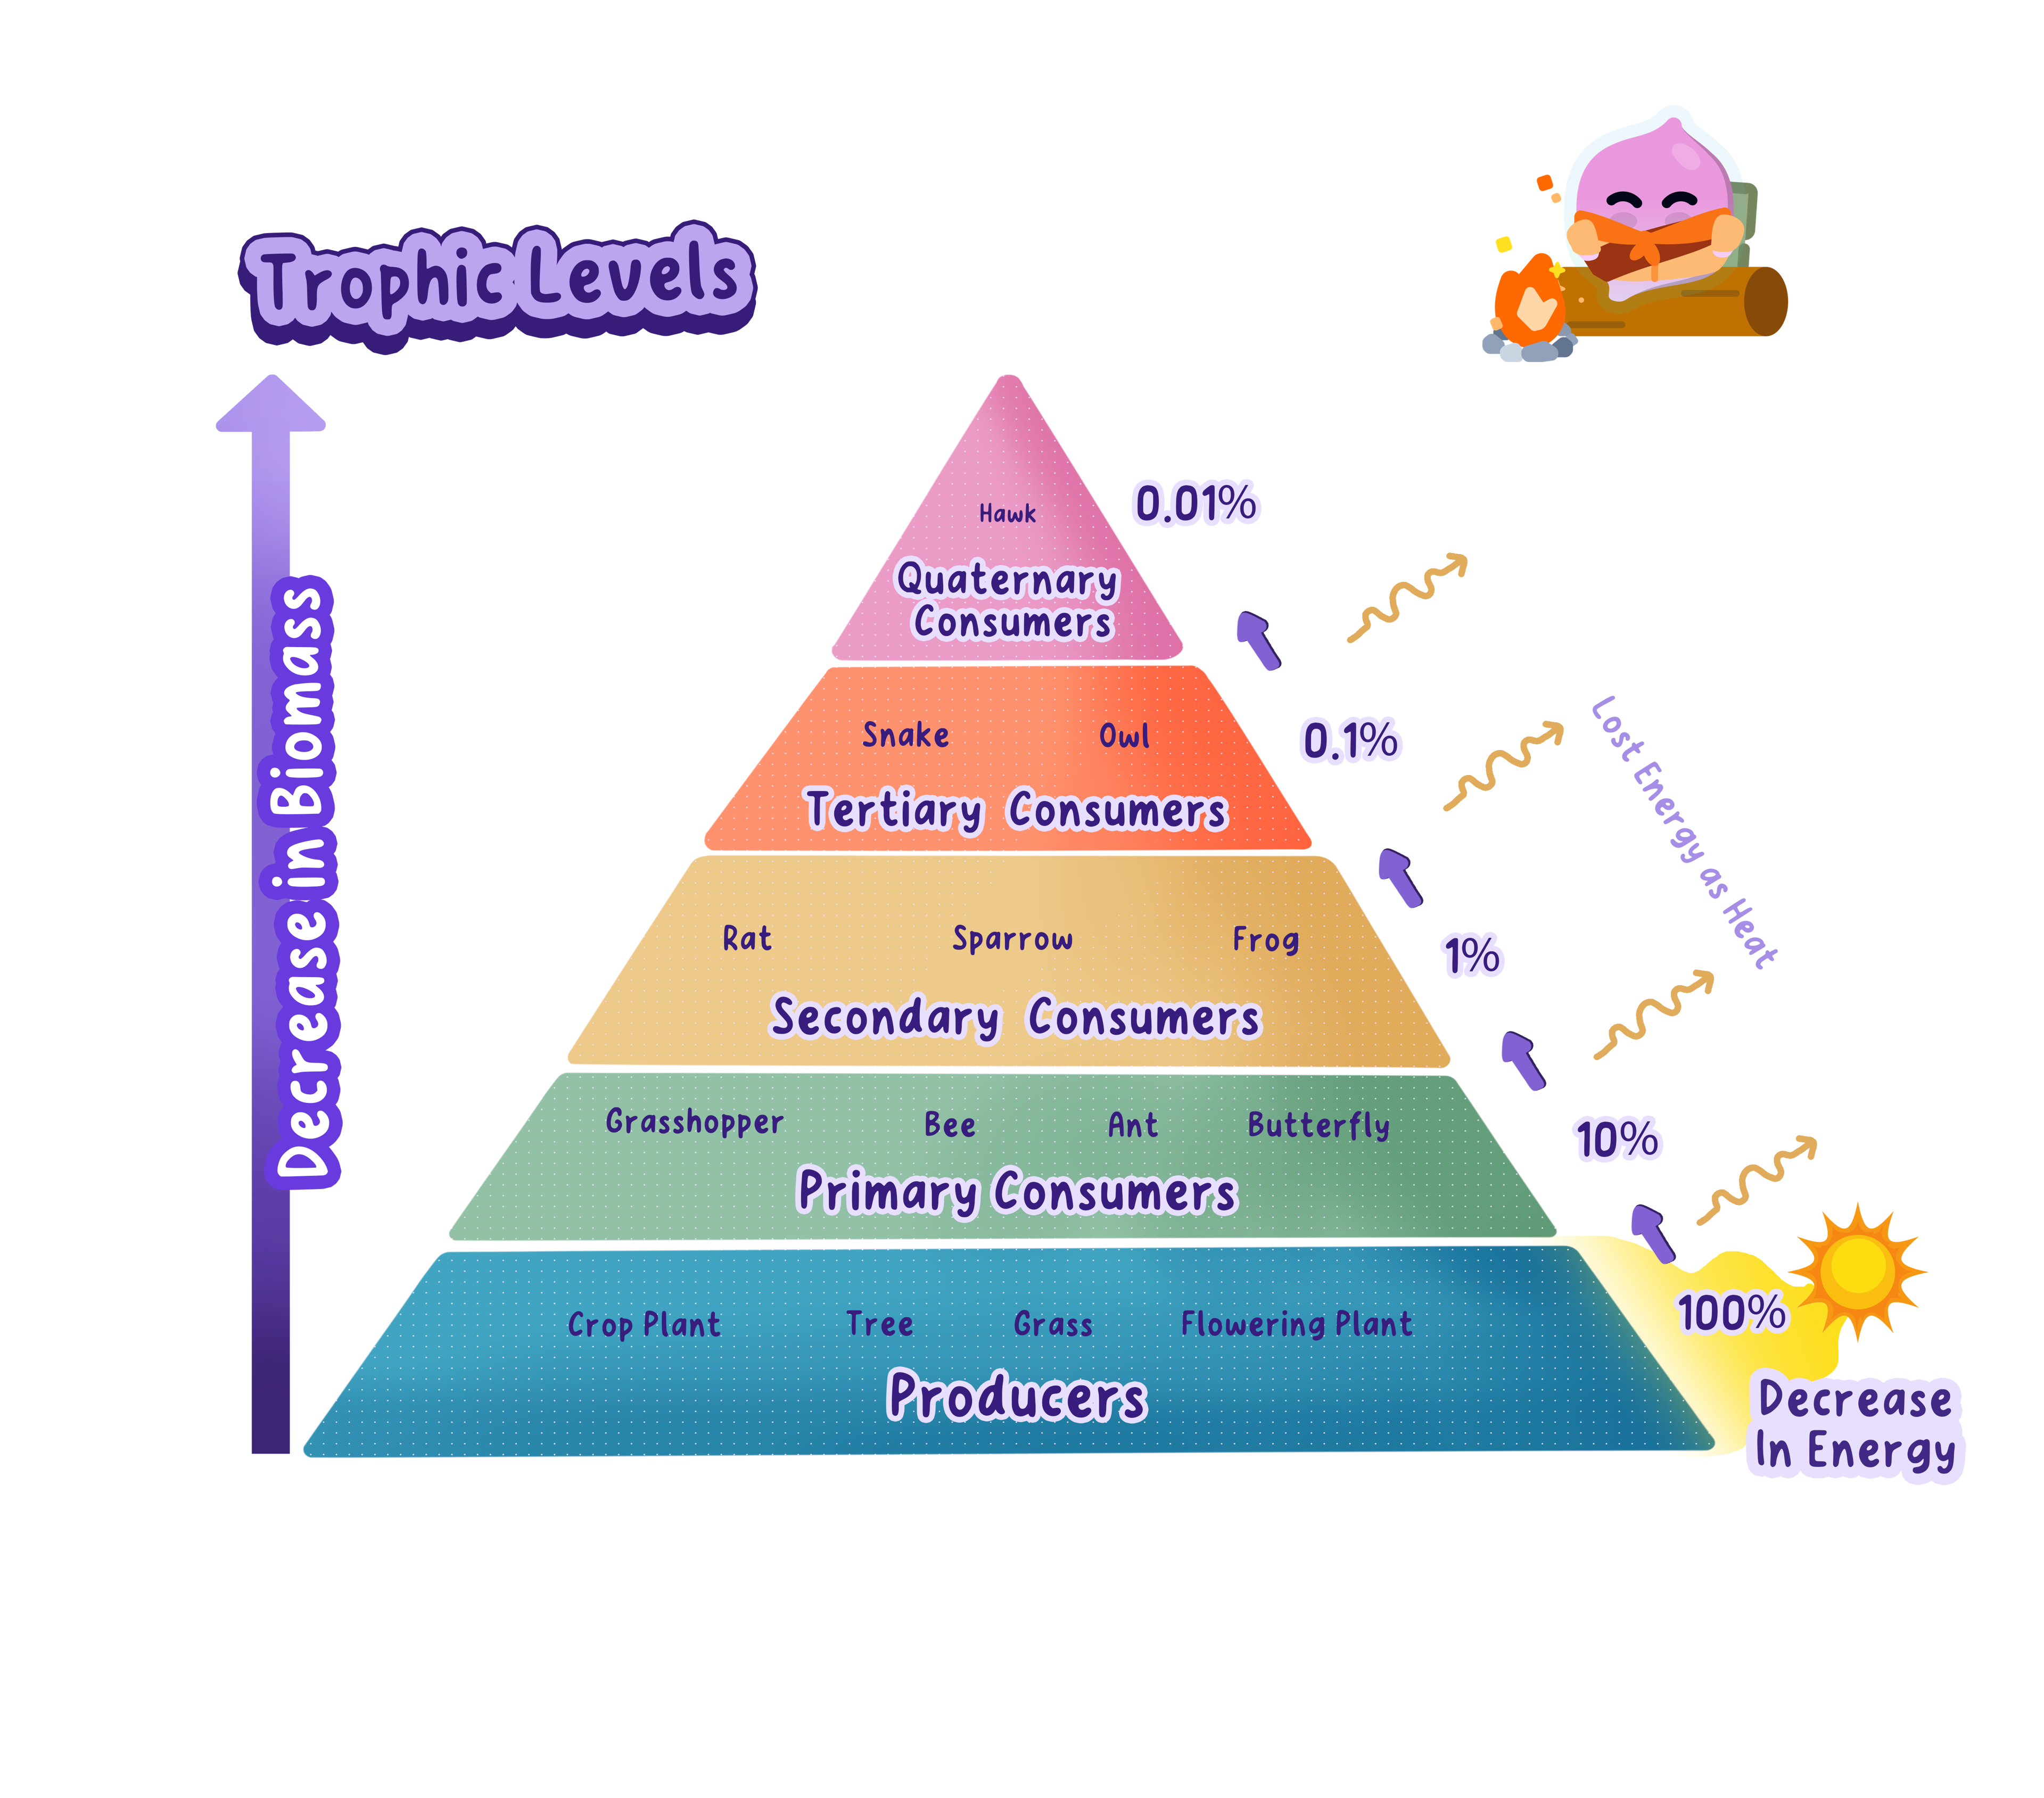
- A trophic level is a feeding position in a food chain, with producers at trophic level 111.
- Only energy stored in an organism's new biomass can be transferred to the next trophic level when that biomass is eaten.
- Some organisms or body parts are not eaten, so the chemical energy in that material is not transferred to the consumer.
- Some eaten material cannot be digested and is egested in faeces, so its chemical energy is not absorbed into the consumer's body.
- Some absorbed substances are excreted, including nitrogen-containing waste in urine, so this material cannot become food for the next trophic level.
- Respiration transfers chemical energy from food for movement, active transport, growth, repair and temperature control, and much of this energy eventually spreads to the surroundings as heat.
Do not write that energy disappears: energy is transferred to the surroundings or remains in material that does not pass to the next trophic level.
Less energy supports fewer organisms
- Each higher trophic level receives less usable chemical energy, so it can build less new biomass.
- Less biomass provides food for fewer individuals, which is why populations are usually smaller at higher trophic levels.
- Top predators need many prey organisms across a large feeding area because so little of the original energy reaches them.
- After several transfers, too little energy remains to support another stable consumer population, which limits most food chains to a small number of trophic levels.
- A grassland can support many grass plants, fewer rabbits and still fewer foxes because energy is lost at both feeding transfers.
- The fox population cannot be larger than the rabbit population for long because each fox needs energy from many rabbits.
Biomass pyramids narrow upwards
Pyramid of biomass
A diagram in which the width of each bar shows the mass of living material at each trophic level in a food chain.
- A pyramid of biomass uses horizontal bars whose widths are proportional to the total dry mass of organisms at each trophic level.
- The producer bar is placed at the bottom, followed by primary, secondary and higher consumers in feeding order.
- Biomass normally decreases at each transfer because only part of the material at one level becomes new biomass at the next level.
- The bars therefore become narrower towards the top, showing why less living material and usually fewer organisms can be supported.
- If producers contain 12 000 g12\,000\,\mathrm{g}12000g of biomass, primary consumers contain 1 800 g1\,800\,\mathrm{g}1800g and secondary consumers contain 180 g180\,\mathrm{g}180g, the three bars must be drawn in those proportions.
- The secondary-consumer bar is one tenth of the primary-consumer bar because 180÷1 800=0.10180 \div 1\,800 = 0.10180÷1800=0.10.
Pyramid diagrams must match the data
- Draw separate horizontal bars rather than a triangle, because each bar must show the biomass of one trophic level.
- Label the producer at the bottom and arrange every consumer above it in the order shown by the food chain.
- Use the numerical values to set the relative widths instead of drawing equally spaced steps.
- Marks are commonly awarded separately for the correct trophic order and for bar widths that match the biomass values.
- A correctly labelled triangle can gain a labelling mark but does not show the required biomass proportions.
Transfer rates are not fixed
- The often-used 10%10\%10% transfer figure is a rough model, not a rule that applies to every ecosystem or every trophic level.
- Transfer depends on factors such as how much of each organism is eaten, how much is digestible and how much energy the organisms use in respiration.
- Use values supplied in a question when explaining a particular food chain instead of assuming that every transfer is 10%10\%10%.
- What is a trophic level?
- Why is energy in faeces unavailable to the next trophic level?
- How does energy loss limit the length of a food chain?
- How should the bars in a pyramid of biomass be arranged?
9.2.2 Efficiency of energy transfers
Efficiency is the percentage transferred
Energy transfer efficiency
The percentage of energy or biomass at one trophic level that is passed on to the next, found by dividing the amount transferred by the amount available and multiplying by 100.
- Energy transfer efficiency compares the energy passed to the next trophic level with the energy available at the trophic level below.
- Use the same energy unit in the numerator and denominator so the units cancel and the final answer is a percentage.
- The general equation is efficiency=amount transferredamount available×100\text{efficiency} = \dfrac{\text{amount transferred}}{\text{amount available}} \times 100efficiency=amount availableamount transferred×100.
- For energy data, write it as efficiency of energy transfer=energy at the next trophic levelenergy at the previous trophic level×100\text{efficiency of energy transfer} = \dfrac{\text{energy at the next trophic level}}{\text{energy at the previous trophic level}} \times 100efficiency of energy transfer=energy at the previous trophic levelenergy at the next trophic level×100.
- A caterpillar population receives 12 000 kJ12\,000\,\mathrm{kJ}12000kJ from leaves and stores 1 800 kJ1\,800\,\mathrm{kJ}1800kJ as biomass available to birds.
- Substitution gives efficiency=1 80012 000×100=15%\text{efficiency} = \dfrac{1\,800}{12\,000} \times 100 = 15\%efficiency=120001800×100=15%.
- The energy transfer efficiency from leaves to caterpillars is therefore 15%15\%15%.
The denominator is the previous level
- The amount transferred belongs on top of the fraction and the amount available before the transfer belongs underneath.
- Dividing in the opposite order can produce a value above 100%100\%100%, which is not possible for trophic transfer efficiency.
- If the figures use different units, convert them before calculating, such as changing both values to kJ\mathrm{kJ}kJ or both to J\mathrm{J}J.
- A correct final value can receive full calculation marks, but showing the substitution makes an arithmetic slip easier to identify.
Do not divide by the original producer value unless the question asks for the overall efficiency from the producer to the stated level.
Biomass uses the same calculation
Biomass
The total mass of living material, usually measured as dry mass, present in an organism or at a trophic level.
- Biomass is usually measured as dry mass because water content changes and does not represent stored organic material fairly.
- For biomass data, use biomass transfer efficiency=biomass at the next trophic levelbiomass at the previous trophic level×100\text{biomass transfer efficiency} = \dfrac{\text{biomass at the next trophic level}}{\text{biomass at the previous trophic level}} \times 100biomass transfer efficiency=biomass at the previous trophic levelbiomass at the next trophic level×100.
- The biomass values may be totals or values per unit area, but both values in one calculation must use the same basis and units.
- A field contains 360 kg360\,\mathrm{kg}360kg of plant biomass and 54 kg54\,\mathrm{kg}54kg of herbivore biomass.
- Substitution gives efficiency=54360×100=15%\text{efficiency} = \dfrac{54}{360} \times 100 = 15\%efficiency=36054×100=15%.
- The biomass transfer efficiency is 15%15\%15%, so 85%85\%85% of the plant biomass was not converted into herbivore biomass.
Percentages can find a missing value
- Convert a percentage to a decimal before multiplying when the transferred amount is unknown.
- For an efficiency of 8%8\%8%, the decimal multiplier is 8100=0.08\dfrac{8}{100} = 0.081008=0.08.
- The transferred amount is found from amount transferred=amount available×efficiency100\text{amount transferred} = \text{amount available} \times \dfrac{\text{efficiency}}{100}amount transferred=amount available×100efficiency.
- If plants store 2 500 kJ2\,500\,\mathrm{kJ}2500kJ and the transfer efficiency is 8%8\%8%, the consumer receives 2 500×8100=200 kJ2\,500 \times \dfrac{8}{100} = 200\,\mathrm{kJ}2500×1008=200kJ.
- The answer keeps the energy unit because the calculation finds an amount of energy rather than a percentage.
Use the data given
- Read the labels carefully to identify the two adjacent trophic levels involved in the transfer.
- Keep full calculator values during working and round only the final answer to the precision requested.
- A transfer percentage is not the same as a percentage decrease, so use the numerator named in the efficiency equation.
- Write the fraction with the next level on top before entering numbers into the calculator.
- Include the multiplication by 100100100 and the percent sign when the question asks for efficiency.
- Check that the result lies between 0%0\%0% and 100%100\%100%.
Check the method and units
- A sensible answer is smaller than 100%100\%100% because some energy and biomass fail to reach the next trophic level.
- An energy answer needs an energy unit such as kJ\mathrm{kJ}kJ, whereas an efficiency answer needs %\%%.
- Write the equation for energy transfer efficiency.
- Which trophic level supplies the denominator?
- Why is dry mass preferred when biomass is compared?
- How much energy is transferred from 4 000 kJ4\,000\,\mathrm{kJ}4000kJ at an efficiency of 12%12\%12%?
9.2.3 Human interactions and biodiversity
Biodiversity changes when populations change
Biodiversity
The number of different species that live in an area.
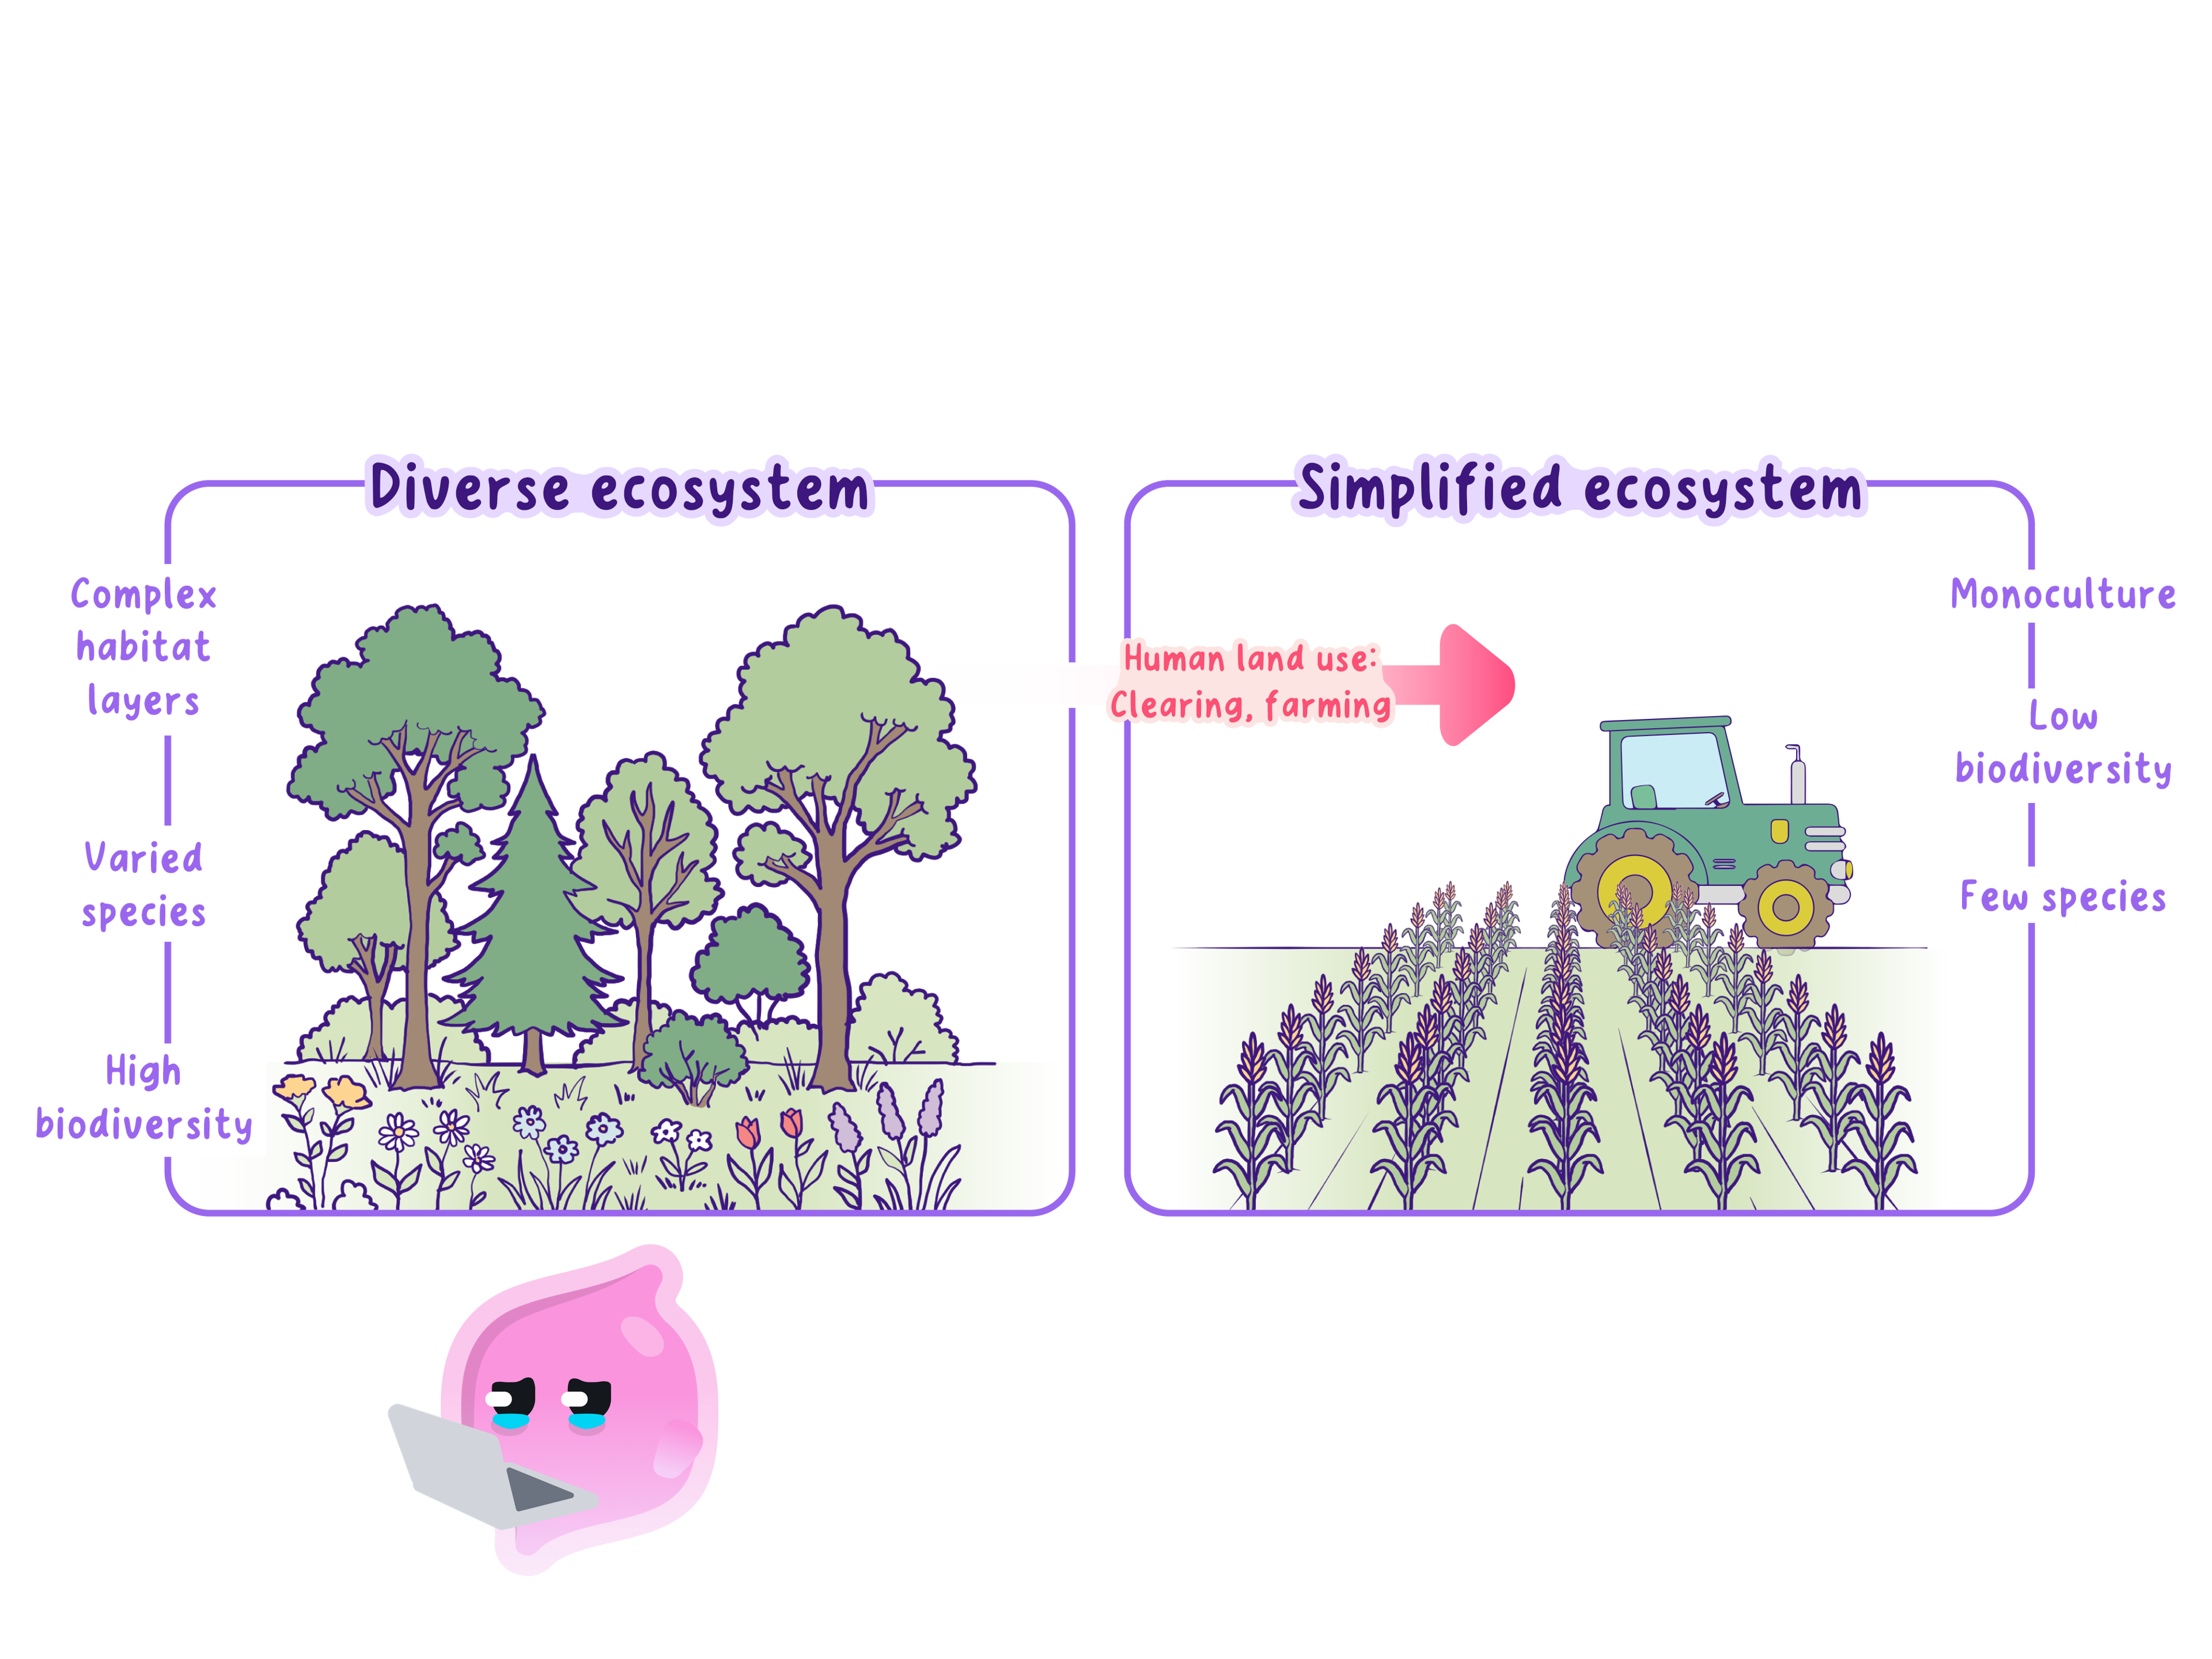
- Biodiversity is reduced when human activity causes native populations to fall, removes species or simplifies food webs.
- An interaction can have both benefits and costs, so its effect depends on how it changes habitats, competition, predation, disease and pollution.
- A strong biological explanation follows a chain from the human action to a changed condition, then to a population change and finally to biodiversity.
- Name the affected resource or condition instead of writing only that an organism is harmed.
- Finish the explanation by stating whether a named population and biodiversity increase or decrease.
Fish farming can help or harm
Fish farming
The rearing of fish in controlled enclosures for food.
- Fish farms can produce a predictable food supply and may reduce pressure on wild fish populations if fewer wild fish are caught for people to eat.
- Controlled feeding, protection from predators and selective breeding can increase survival and yield.
- High stocking density lets pathogens and parasites spread rapidly, and infections can pass to wild fish near open cages.
- Uneaten feed and faeces add organic matter and mineral ions to the water, which can reduce oxygen concentration and change the species able to survive.
- Medicines and chemicals used in farms can affect non-target organisms, while escaped farmed fish may compete or breed with wild populations.
- Some farmed fish are fed fishmeal made from wild-caught fish, so farming can still reduce wild populations lower in the food web.
- A coastal cage farm increases the local food supply, but waste below the cages raises decomposer activity and lowers dissolved oxygen.
- If oxygen-sensitive species leave or die while tolerant species remain, local biodiversity falls even though fish production rises.
Introduced species alter competition
Non-indigenous species
A species living outside its natural geographical range because it has been introduced by humans, deliberately or accidentally.
- A non-indigenous species may be introduced deliberately for food, ornament or biological control, or arrive accidentally in cargo, ballast water or on equipment.
- An introduced species can add a useful food source or control a pest, but it may become invasive if it spreads rapidly and causes ecological harm.
- Without its usual predators or diseases, its population may grow quickly and compete with native species for food, light, space, oxygen or breeding sites.
- It may eat native organisms, carry new pathogens or alter habitats, causing native populations to decline and disrupting food webs.
- If native species disappear locally, species richness and biodiversity decrease.
- Introduced signal crayfish compete with native crayfish for food and shelter.
- They can also carry a pathogen that causes disease in native crayfish.
- Competition and disease reduce the native population, so local biodiversity may fall.
Eutrophication removes oxygen
Eutrophication
The process in which excess nutrients in water cause rapid algal growth, leading to oxygen depletion and the death of aquatic organisms.
- Nitrate or phosphate ions from fertiliser runoff, animal waste or sewage enter a pond, lake or slow-moving river.
- The extra mineral ions remove a growth limitation, so algae reproduce rapidly and form an algal bloom near the surface.
- The dense algal growth blocks light, so submerged plants photosynthesise less and may die.
- Dead algae and plants are broken down by decomposer microorganisms.
- The decomposers respire aerobically and use dissolved oxygen faster than it is replaced.
- The oxygen concentration falls, so fish and other oxygen-dependent animals may suffocate, move away or die.
- The loss of sensitive species and dominance of a few tolerant species reduce biodiversity.
- Keep the sequence in order: mineral ions, algal bloom, less light, plant death, decomposition, respiration, oxygen loss and animal death.
- If the question asks about fish, complete the chain with the direct effect on fish rather than stopping at low oxygen.
- Use the terms algal bloom, decomposer, aerobic respiration and dissolved oxygen accurately.
Balance benefits against biodiversity costs
- A valid judgement identifies the benefit of the human activity and weighs it against the size, likelihood and reversibility of its ecological effects.
- Management can reduce damage through lower fish stocking densities, waste treatment, secure cages, quarantine and controls on releasing non-indigenous species.
- The conclusion should be based on the evidence in the question because the same interaction can have different effects in different ecosystems.
- How can fish farming reduce pressure on wild fish?
- How can a non-indigenous species reduce a native population?
- Why does an algal bloom cause dissolved oxygen to fall?
- Which final link must be stated when explaining an effect on biodiversity?
9.2.4 Benefits of maintaining biodiversity
Biodiversity keeps ecosystems functioning
Biodiversity
The number of different species that live in an area.
- High biodiversity gives a food web more feeding links, so the loss of one population is less likely to collapse the whole ecosystem.
- Different species provide pollination, decomposition, nutrient cycling, soil formation, water purification and control of pest populations.
- Genetic variation within wild populations provides alleles that may help species survive disease or environmental change.
- Wild species are possible sources of foods, medicines and genes for breeding disease-resistant or climate-tolerant crops and livestock.
- Habitats and wildlife also support recreation, tourism, scientific study and cultural value.
- If one pollinator population falls, a diverse ecosystem may contain other pollinator species that continue fertilising flowering plants.
- Seed and fruit production can continue, which supports both plant populations and the animals that feed on them.
Animal conservation prevents extinction
Conservation
The protection and careful management of species and habitats to maintain biodiversity.
- Protecting and restoring habitats gives animals food, shelter, breeding sites and space to maintain viable populations.
- Legal controls can restrict hunting, collection and trade, while protected areas reduce disturbance and habitat destruction.
- Captive-breeding programmes pair individuals to retain genetic variation, then reintroduce offspring when threats in the wild have been reduced.
- Monitoring population size and genetic diversity shows whether conservation action is working and whether inbreeding is becoming a risk.
- Preventing extinction keeps the conserved species in its food web as a predator, prey, competitor, pollinator or seed disperser.
- A captive-breeding programme increases the number of an endangered predator before animals are released into protected habitat.
- The species is less likely to become extinct, and its prey population remains under predation pressure, helping to preserve the food web.
Reforestation rebuilds habitats
Reforestation
The replanting of trees in an area where forest has been removed.
- Planting a mixture of native tree species creates varied food sources and habitats for microorganisms, plants and animals.
- As the woodland develops, more niches become available and local species richness can increase.
- Trees remove carbon dioxide from the atmosphere during photosynthesis and store carbon in wood, roots and soil organic matter.
- Photosynthesis releases oxygen, so reforestation can lower atmospheric carbon dioxide and raise oxygen over time.
- Roots bind soil and tree canopies reduce the force of rain, which limits erosion and protects soil habitats and nearby aquatic ecosystems from sediment.
- Connected woodland can form wildlife corridors, allowing animals to move between populations and maintain gene flow.
- A single-species plantation provides fewer habitats and is more vulnerable to one pest or pathogen than a mixed native woodland.
- Newly planted trees do not replace the biodiversity or carbon store of a mature forest immediately.
Conservation works at two scales
- Local action protects particular habitats and populations, while coordinated action across countries protects migratory species, shared seas and global gene pools.
- Maintaining biodiversity requires continued habitat management because protected populations can decline again if the original pressure returns.
- Give two biological benefits of high biodiversity.
- How can captive breeding reduce extinction risk?
- How does reforestation change atmospheric carbon dioxide and oxygen?
- Why does mixed native woodland usually support more species than a single-species plantation?
9.2.5 Biological factors affecting food security
Food security depends on supply and access
Food security
Food security is reliable access to enough safe, nutritious and affordable food for a population.
- Food security exists when a population has reliable access to enough safe, nutritious and affordable food for a healthy diet.
- A factor lowers food security if it reduces the amount or variety of food, interrupts supply or raises prices beyond what people can afford.
- Biological explanations should connect the factor to crop or livestock yield and then to availability, variety, price or access.
- If a crop disease halves a potato harvest, less food reaches markets and the reduced supply can raise prices.
- People on low incomes may then buy less food or a less varied diet, so food security falls.
Population growth increases demand
- A larger human population requires more total energy, protein, vitamins, minerals and water from the food system.
- If food production grows more slowly than the population, the amount available per person falls.
- More farmland and irrigation may be needed, which increases competition for land and fresh water and can damage habitats or soils.
- Shortages raise prices and make reliable access hardest for people with low incomes.
Link population growth to increased demand, then compare that demand with the rate at which food supply can increase.
Meat and fish use more resources
- Rising meat consumption increases animal farming, so more crops, land and water are used to feed livestock rather than people directly.
- Energy and biomass are lost between trophic levels, so feeding crops to animals produces less human food energy than eating suitable crops directly.
- Livestock also require housing, temperature control, medicines and waste management, which increase agricultural inputs and production costs.
- Greater demand for fish can cause overfishing, reducing breeding populations and making future catches smaller.
- Fish farming can increase supply, but it requires feed and careful control of disease, waste and escapees to remain sustainable.
- If people eat grain directly, they receive energy from the producer trophic level after one harvest.
- If grain feeds cattle first, much of its energy is used in cattle respiration and lost in waste before the meat is eaten.
- The same area of grain can therefore provide less food energy through cattle than through direct consumption.
Pests and pathogens cut yields
Pathogen
A microorganism that causes disease. Pathogens include some bacteria, viruses, fungi and protists.
- Pests eat crops, damage stored food or compete with livestock, so less usable food reaches people.
- Plant pathogens reduce photosynthesis, growth or reproduction, while animal pathogens reduce growth, fertility and survival.
- A new pathogen can spread quickly if crops or livestock lack resistance, especially where many genetically similar individuals are kept together.
- Diseased animals may need to be isolated or culled, and infected crops may need to be destroyed, which reduces supply immediately.
- Pesticides, medicines, resistant varieties and biosecurity can limit losses, but they add costs and may become less effective as resistance evolves.
- A new fungal pathogen infects a genetically uniform wheat crop, reducing leaf area and photosynthesis.
- Plants make less glucose and produce fewer grains, so the harvest and food supply fall.
Environmental change reduces harvests
- Human greenhouse-gas emissions increase global temperatures and alter rainfall patterns, raising the risk of drought, flooding and heat stress.
- Drought closes stomata and limits photosynthesis, while flooding reduces oxygen around roots and can kill crop plants.
- Warmer conditions can shift the ranges of pests, pathogens and pollinators, exposing farms to new diseases or reducing pollination.
- Sea-level rise can make coastal soils and irrigation water saltier, reducing water uptake and crop growth.
- More frequent crop failures make supply less reliable and increase price variation.
A graph showing rising carbon dioxide supports a change in atmospheric composition, but the effect on food security still needs a biological link through climate, crop growth, pests or yield.
Biofuels compete with food crops
Biofuel
A fuel made from living or recently living material, such as ethanol from crops or biodiesel from plant oils.
- Land used to grow maize, sugar cane or oilseed for biofuel cannot produce food at the same time.
- Diverting edible crops into fuel reduces the food entering markets and can raise prices.
- Clearing new land for fuel crops can remove habitats, release stored carbon and reduce soil quality, which threatens future food production.
- Waste plant material can make biofuel with less direct competition for fertile farmland, but collection and processing still require energy and money.
- If a farmer changes a field from wheat for bread to oilseed for biodiesel, fuel production rises but the local food crop harvest falls.
- Food security falls if the lost wheat is not replaced from another source at an affordable price.
Inputs can limit production
Agricultural inputs
The resources added to a farming system to produce food, including seed, feed, fertiliser, pesticides, machinery, energy, water and labour.
- Fertilisers replace mineral ions removed in harvests, pesticides reduce losses, and fuel and machinery allow large areas to be farmed.
- Feed, seed, water, labour, medicines, fertiliser, pesticides, energy and machinery all add to the cost of producing food.
- If input prices rise, farmers may use less of them, which can reduce yield, or pass the cost to consumers through higher food prices.
- Poorer farmers may be unable to buy high-quality seed, irrigation or disease control, so pests, drought or nutrient shortage cause larger losses.
- Overusing inputs can also damage long-term production through soil degradation, water pollution, pesticide resistance and loss of pollinators.
- Do not stop at saying that farming is expensive: explain whether high costs reduce input use, reduce yield, raise food prices or make food unaffordable.
- When data are provided, quote the trend or value and then connect it to food availability or access.
Sustainable choices protect future supply
Sustainability
Meeting the needs of people today without damaging the ability of future generations to meet their own needs, for example by not using up resources faster than they can be replaced.
- Sustainable food production maintains soil, water supplies, pollinators, wild fish stocks and genetic diversity so production can continue in future years.
- Crop rotation, resistant varieties, efficient irrigation, careful fertiliser use and managed fishing quotas can reduce losses without exhausting the resource base.
- A method is not sustainable if it raises today's yield by causing soil erosion, resistant pests, collapsed fish stocks or permanent habitat loss.
- The best response to a food-security question weighs increased present supply against cost, environmental damage and the ability to keep producing food.
- How can population growth reduce food available per person?
- Why does increased meat consumption require more land and crop feed?
- How can a new pathogen reduce a harvest?
- Why can biofuel production reduce food security?
- How can expensive agricultural inputs affect food supply and access?
