Variation comes from genes and environment
Definition
Variation
Differences in the characteristics of individuals belonging to the same species.
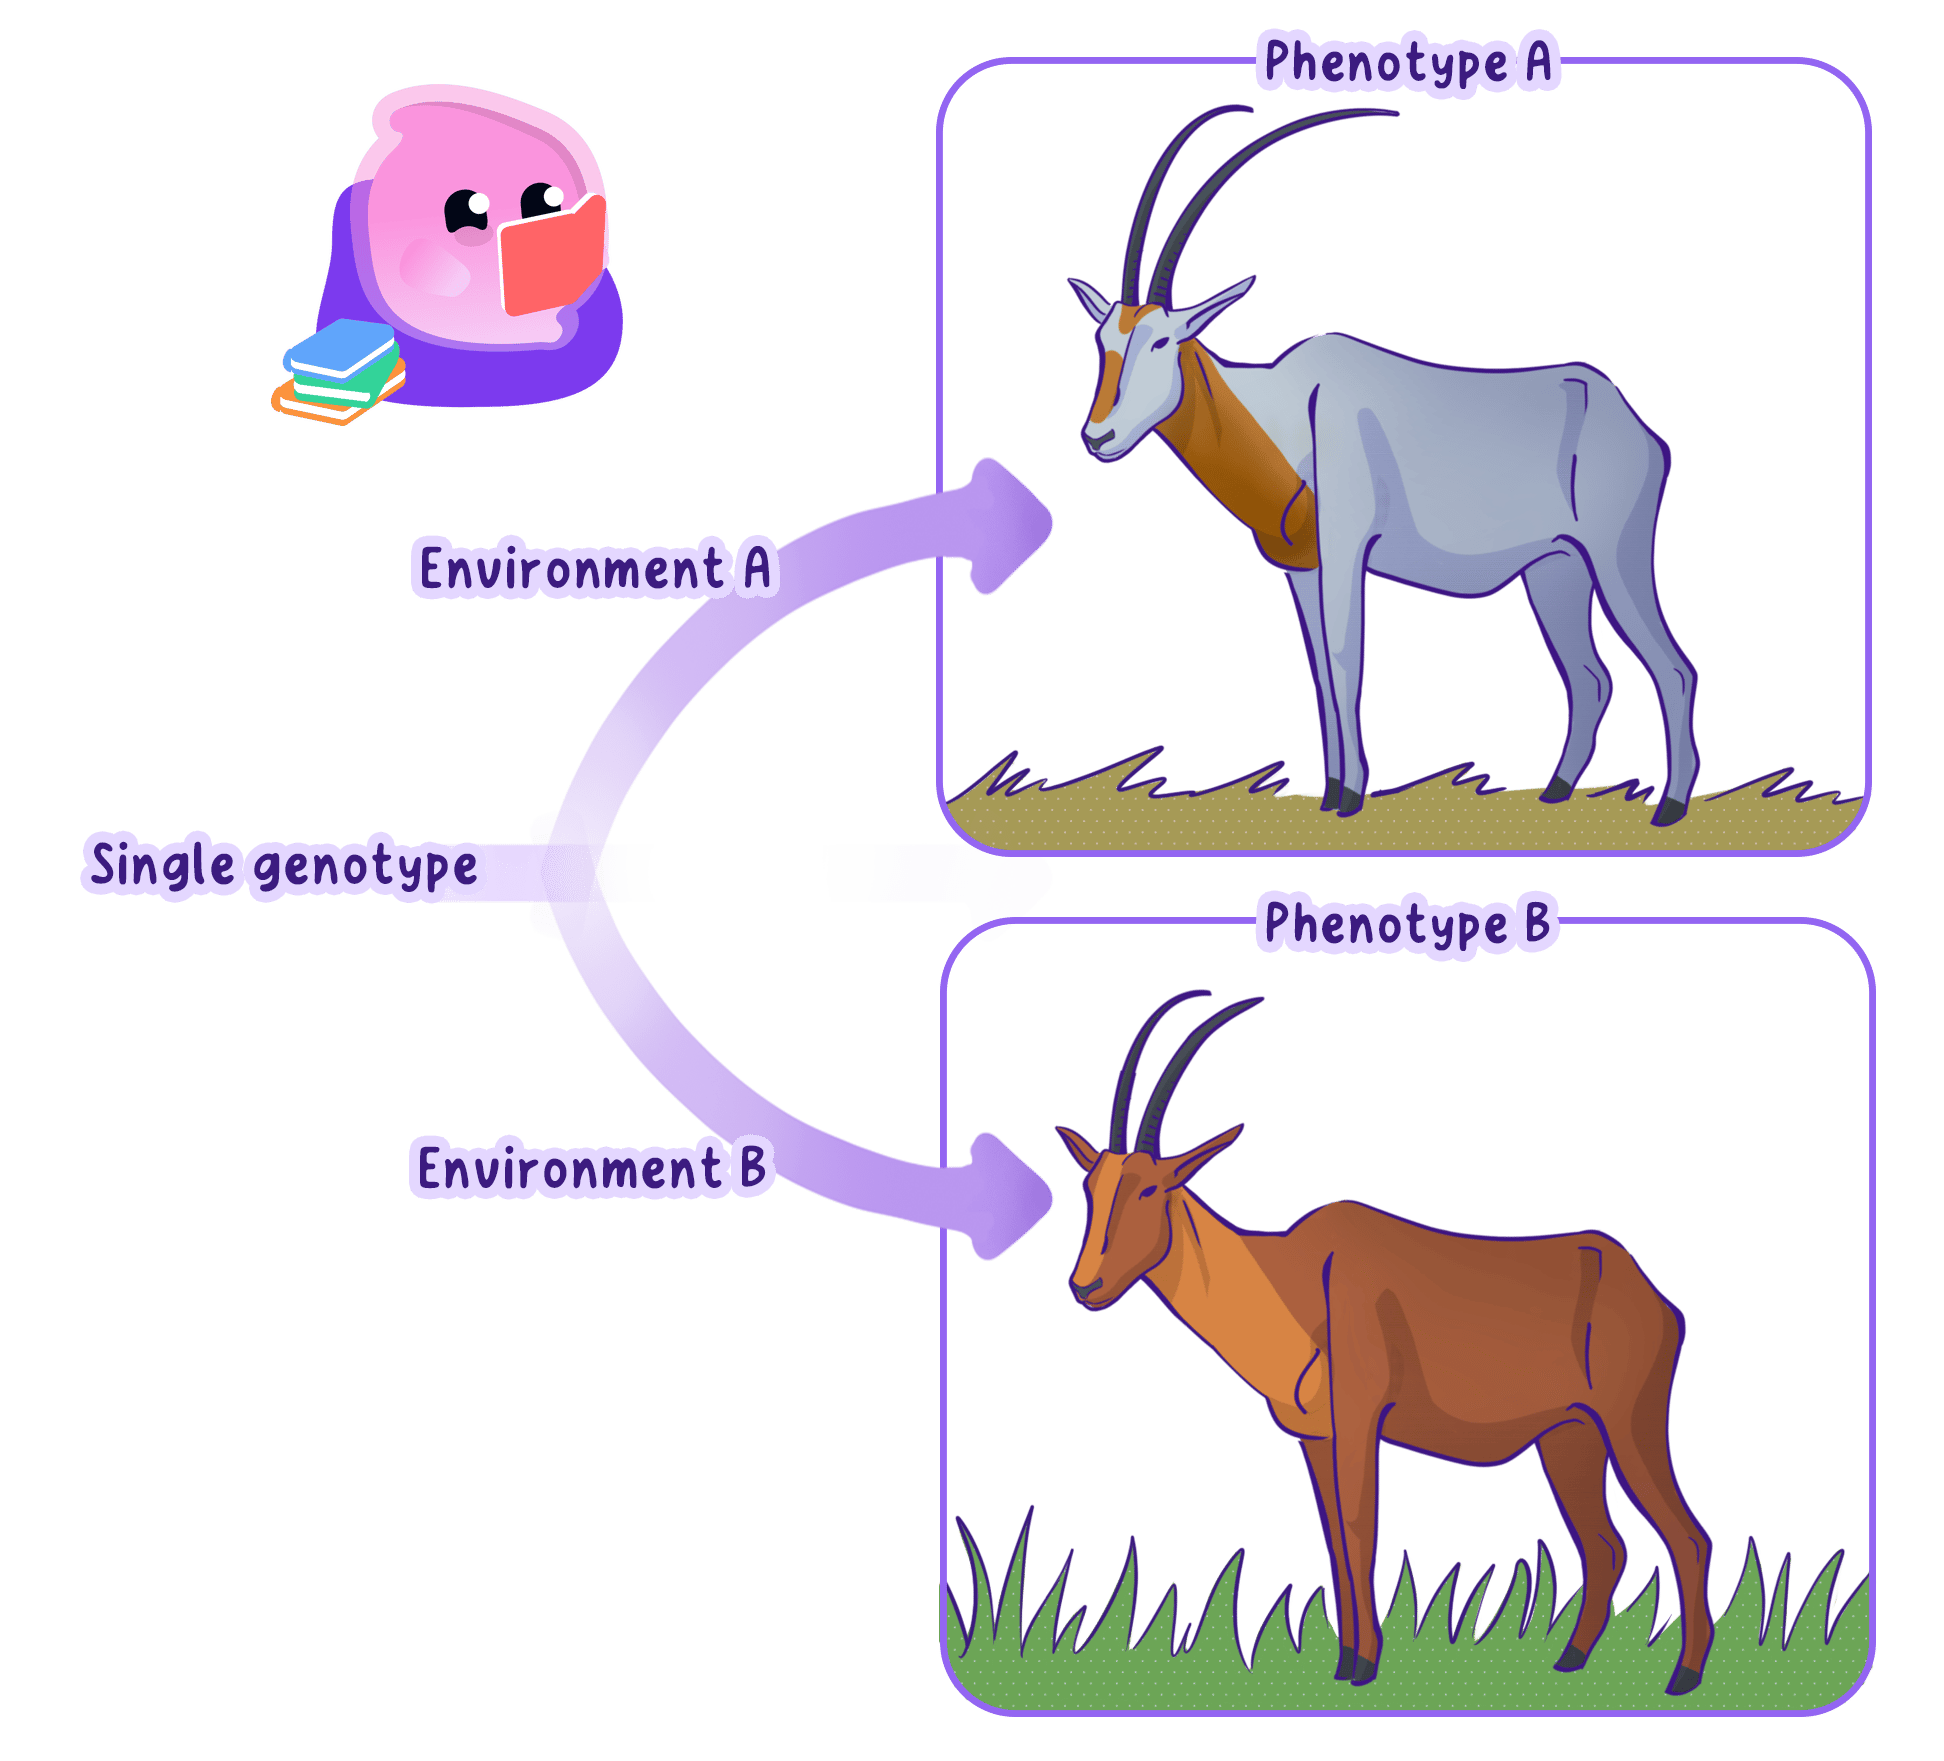
- Genetic variation is caused by differences in the alleles inherited by individuals of the same species.
- Environmental variation is caused by conditions experienced during life, such as diet, light availability or injury.
- Many phenotypes, including height and body mass, result from an interaction between genes and the environment.
Note
In an explanation, identify the genetic factor and the environmental factor, then connect both to the phenotype.
Continuous variation forms a measurable range
Definition
Continuous variation
Variation that produces a continuous range of phenotypes between two extremes, with no distinct categories.
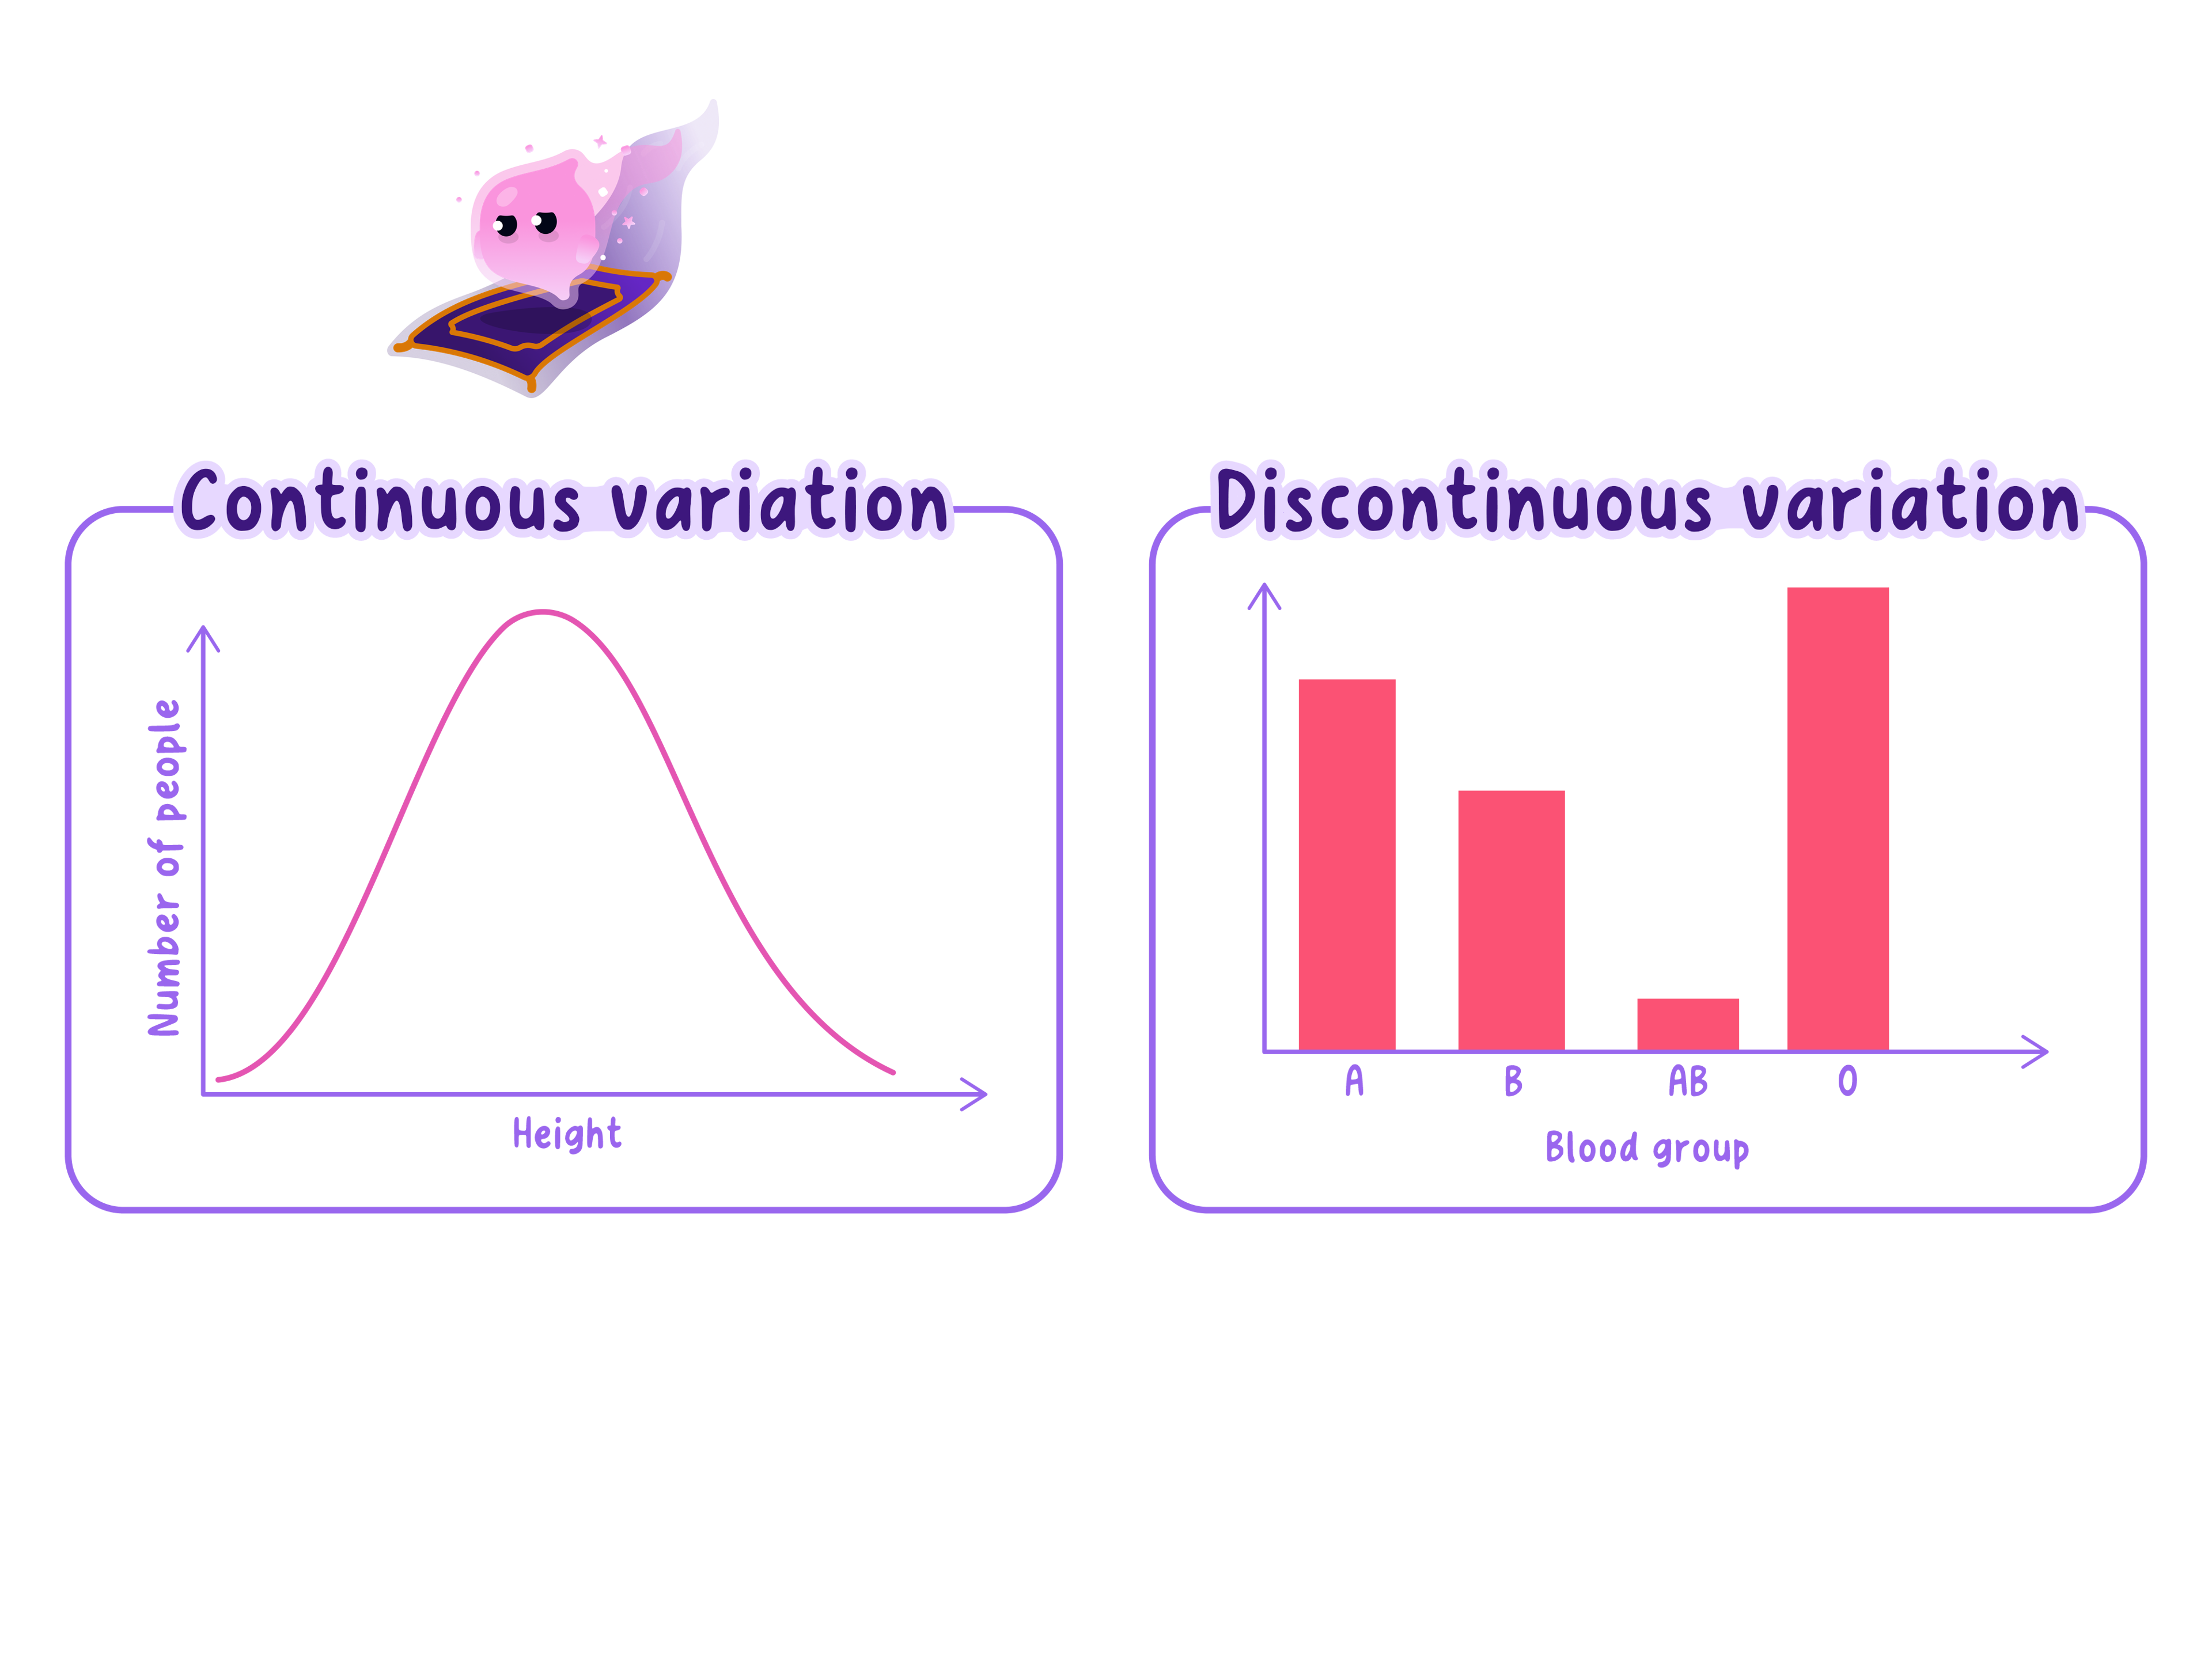
- Continuous variation produces many intermediate values between two extremes, with no distinct categories.
- Examples include height, mass, hand span and leaf length.
- Continuous characteristics are usually affected by many genes and the environment.
- A large sample may form a normal distribution, with most values near the mean and fewer values at either extreme.
- Display continuous data in a histogram with touching bars because the measurement scale has no gaps.
Discontinuous variation forms categories
Definition
Discontinuous variation
Variation in which individuals fall into distinct categories with no intermediate values.
- Discontinuous variation places each individual into one of a limited number of distinct categories.
- Examples include ABO blood group and the ability or inability to roll the tongue.
- Discontinuous characteristics are usually controlled by one gene or a small number of genes, with little environmental influence.
- Display discontinuous data in a bar chart with gaps because the categories are separate.
Example
- Worked example: five seedlings have heights of 8.28.28.2, 9.19.19.1, 9.79.79.7, 10.410.410.4 and 11.6 cm11.6\,\text{cm}11.6cm.
- Calculation: xˉ=8.2+9.1+9.7+10.4+11.65=9.8 cm\bar{x}=\dfrac{8.2+9.1+9.7+10.4+11.6}{5}=9.8\,\text{cm}xˉ=58.2+9.1+9.7+10.4+11.6=9.8cm.
- Interpretation: height is continuous because it can take any value within a range.
Practical
Investigating variation
- Aim: compare continuous and discontinuous variation in a human population.
- Apparatus: use a metre ruler fixed vertically to a wall, a set square, a tape measure, a results table and graphing equipment.
- Method:
- Sampling: select at least 303030 people at random to reduce sampling bias.
- Method 1: ask each person to remove their shoes and stand upright with their heels against the wall.
- Method 2: place the set square horizontally on the head and read height to the nearest 0.1 cm0.1\,\text{cm}0.1cm at eye level.
- Method 3: record one discontinuous characteristic for the same people using clearly defined categories.
- Variables: if two populations are compared, population is the independent variable and the measured characteristic is the dependent variable.
- Controls: keep the measuring instrument, technique, units, observer, sample size and age range the same.
- Processing: group heights into equal intervals and plot a histogram with touching bars.
- Processing: count each discontinuous category and plot a bar chart with separated bars.
- Mean: calculate mean height using xˉ=∑xn\bar{x}=\dfrac{\sum x}{n}xˉ=n∑x.
- Reliability: repeat doubtful measurements and repeat the investigation with another large random sample.
- Safety and ethics: keep the floor clear, obtain consent, record results anonymously and avoid sensitive characteristics.
Results reveal the pattern of variation
- Height should produce many intermediate values and may approximate a normal distribution.
- The discontinuous characteristic should produce separate categories with no intermediate values.
- A larger random sample reduces the influence of unusual individuals and makes the distribution more representative.
Self review
- What is variation?
- How does continuous variation differ from discontinuous variation?
- Which graph should you use for each type of variation?
- Why should a sample be large and randomly selected?
