Question 14
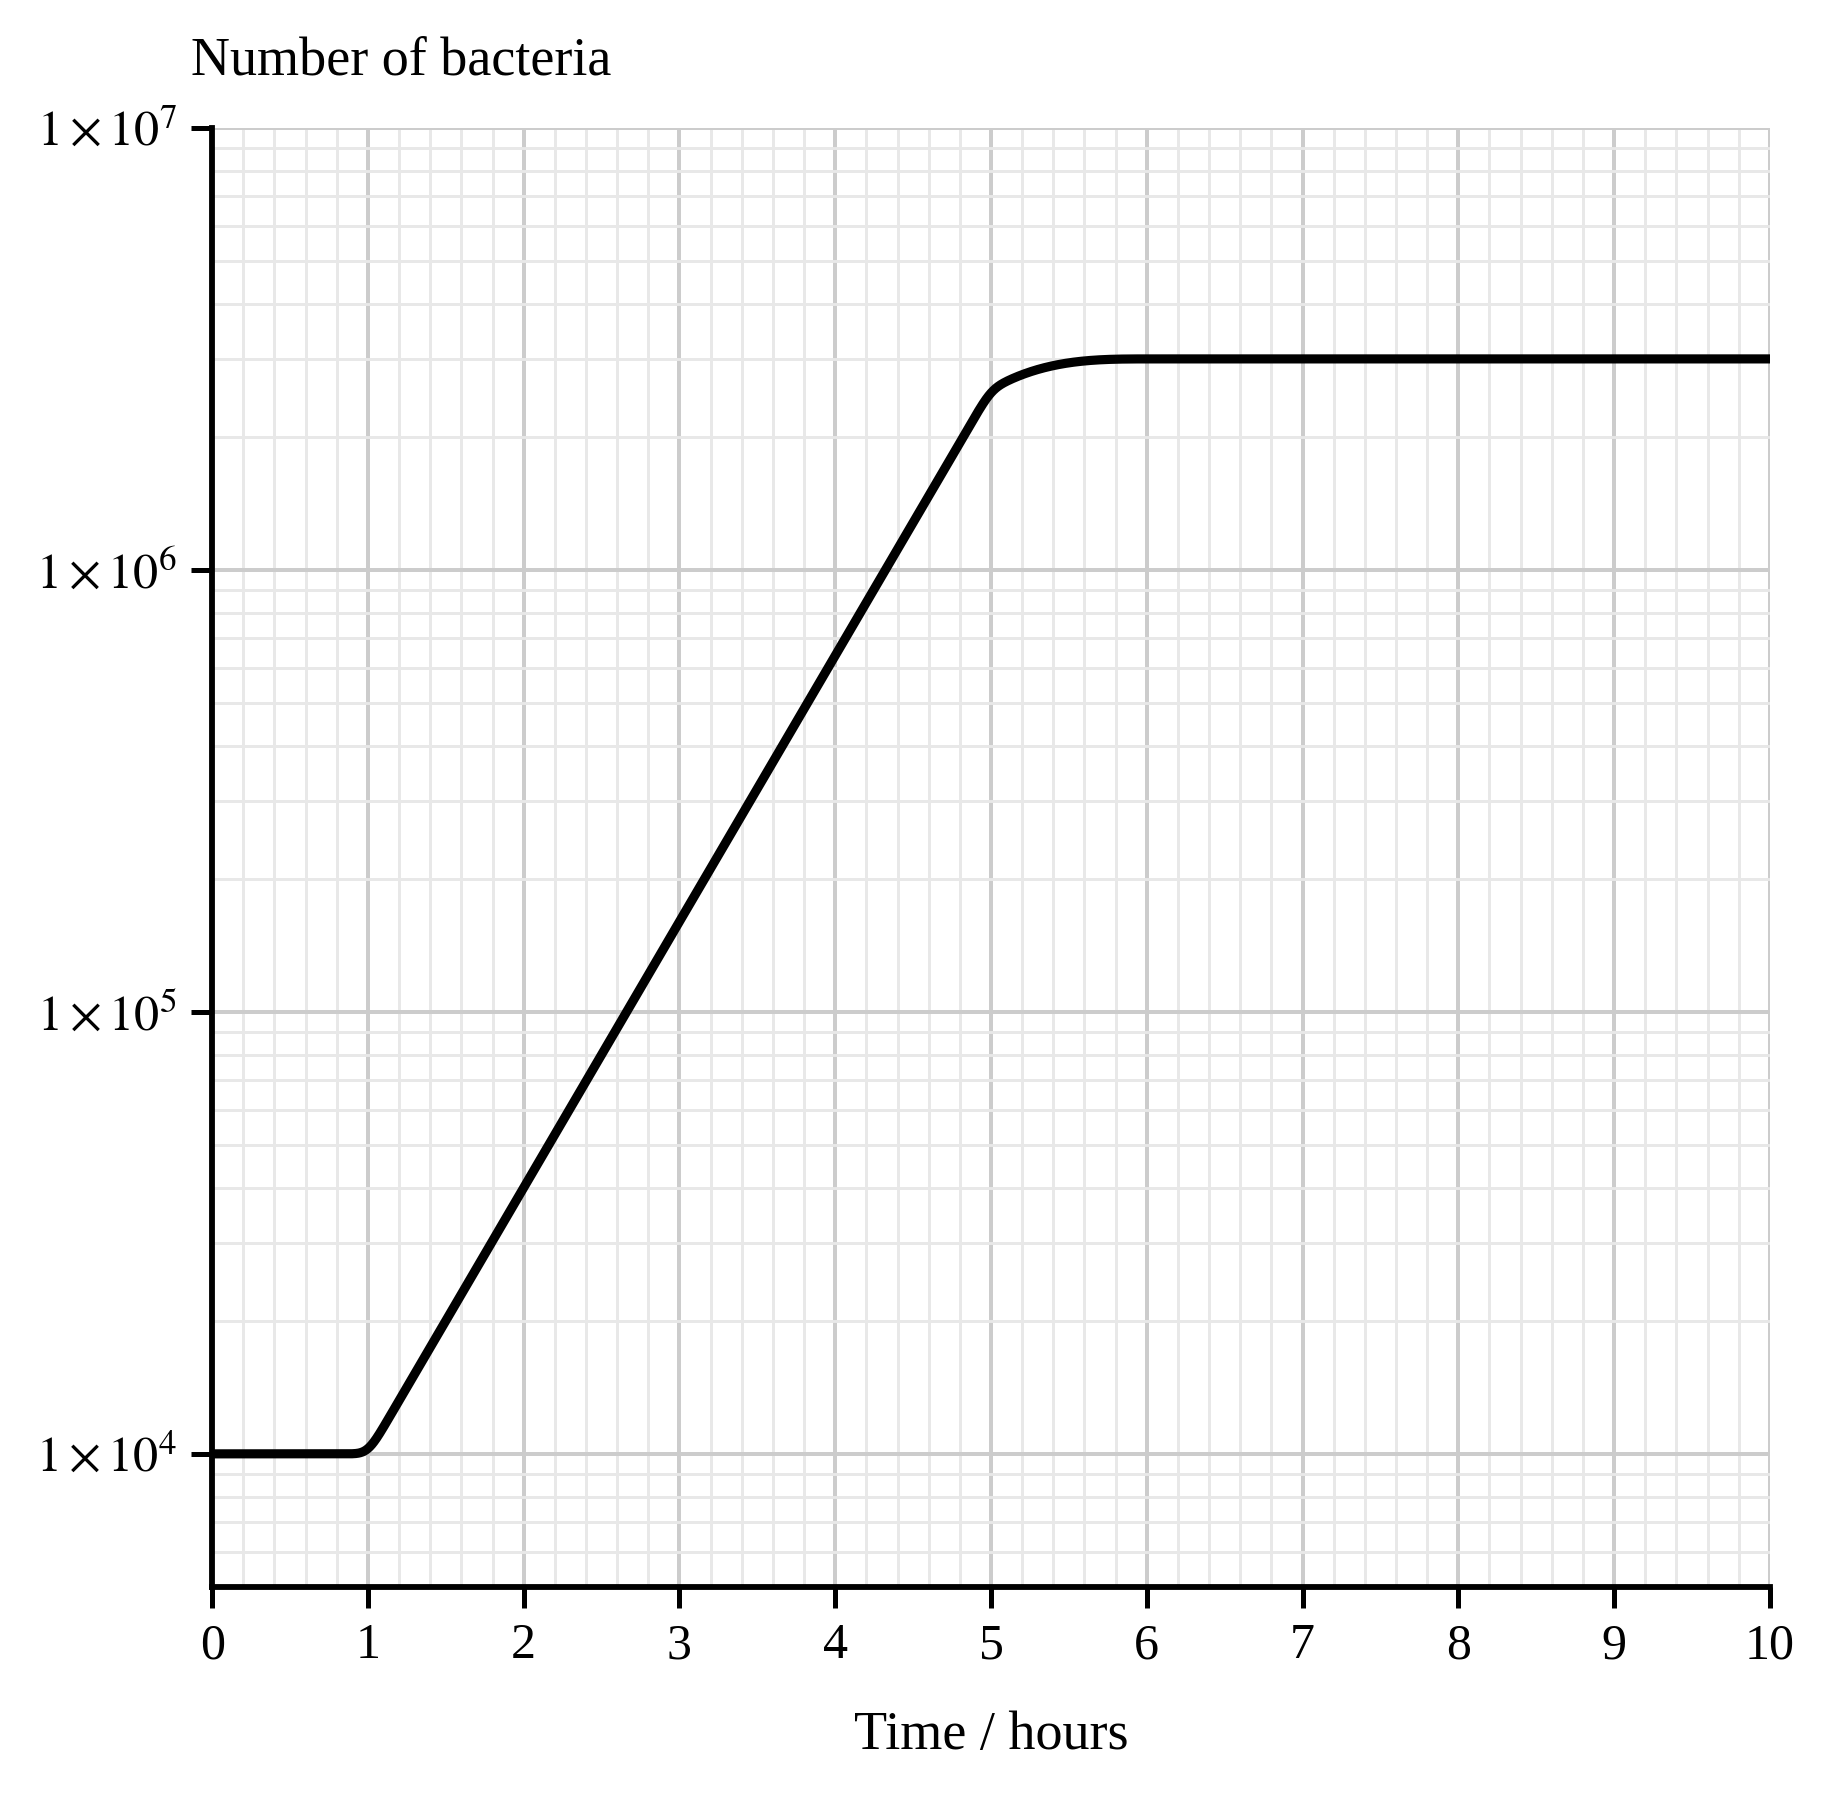
HThe figure shows how the number of bacteria in a flask of nutrient broth changed over 10 hours.
Figure: The number of bacteria in a flask of nutrient broth over 10 hours
a.[3]
Use the figure. Calculate the mean division time of this bacterium between 1 hour and 5 hours.
b.[2]
The curve becomes horizontal after 6 hours.
Explain why.
c.[2]
Predict the number of bacteria in the flask at 7 hours. Give a reason for your answer.
1.1 Cell structure Questions
282 exam-style questions on AQA GCSE Biology 1.1 Cell structure, covering 1.1.1 Eukaryotes and prokaryotes, 1.1.2 Animal and plant cells, 1.1.3 Cell specialisation, 1.1.4 Cell differentiation, 1.1.5 Microscopy, and 1.1.6 Culturing microorganisms. Each one has a worked solution and a mark scheme showing where the marks go.