Frequency Polygons
A frequency polygon is used to display grouped data
To draw a frequency polygon we plot the midpoint of the group against the frequency and then join the points with straight lines
Here is a frequency table showing the time, in minutes, it took for 25 students to get to school one day
| Time | Frequency |
|---|---|
| 0 ≤ t ≤ 10 | 7 |
| 10 ≤ t ≤ 20 | 9 |
| 20 ≤ t ≤ 30 | 6 |
| 30 ≤ t ≤ 40 | 3 |
To draw a frequency polygon we plot the midpoint with each group against the frequency
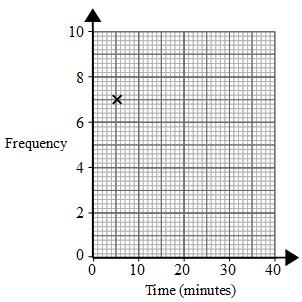
The midpoint of 0 and 10 is 5
We could work this out by adding 0 and 10, and then dividing by 2:
For the first point we plot (5, 7)
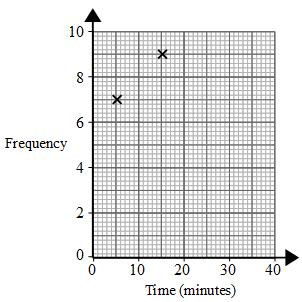
The midpoint of 10 and 20 is 15
The second point is (15,9)
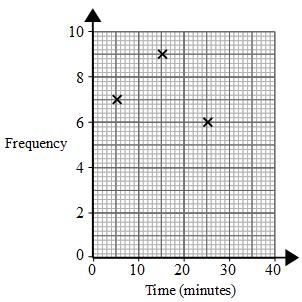
The midpoint of 20 and 30 is 25
The next point is (25,6)
The midpoint of 30 and 40 is 35
The next point is (35,3)
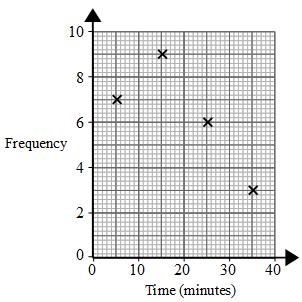
And finally we join the points with straight lines