What you'll learn
- How to design questionnaires and interviews that collect useful self-report data.
- How to choose samples, write alternate hypotheses, and reduce researcher effects.
- How to analyse quantitative and qualitative data from a social psychology practical.
- How ethics, key questions, and classic/contemporary studies link to research methods.
The big picture: research methods in social psychology
Social psychology studies how people’s thoughts, feelings and behaviour are influenced by other people. In this topic, that includes obedience, prejudice, crowd behaviour, in-groups and out-groups.
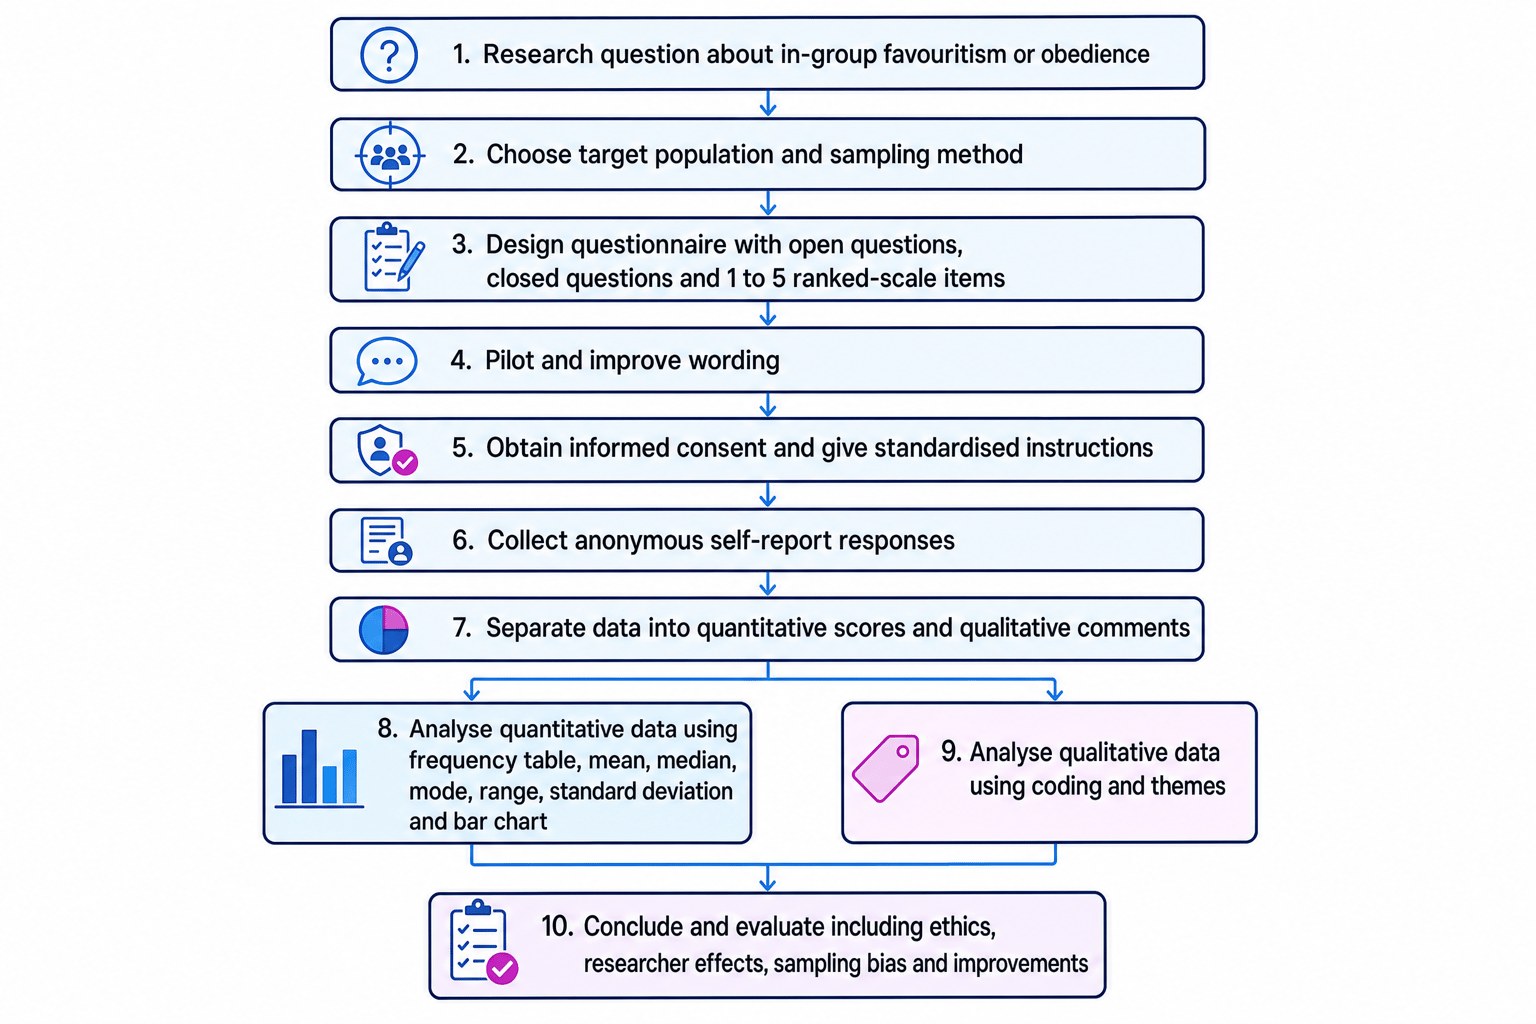
For Edexcel 9PS0, your social psychology practical is based on self-reporting data, usually through a questionnaire. You might investigate whether different groups perceive themselves as more obedient, or whether people show in-group favouritism.
Self-reporting data
Self-reporting data is information participants give about themselves, usually by answering questions about their attitudes, beliefs, feelings or behaviour.
Self-report is useful because it gives direct access to what people think. However, it can be affected by honesty, memory, wording, and the desire to look socially acceptable.
Questionnaires and interviews
Questionnaires
A questionnaire is a set of written or online questions completed by participants. Questionnaires are usually standardised, meaning every participant receives the same questions in the same order.
Good questionnaires are clear, neutral and easy to answer. Avoid questions that are:
- Leading: pushing the participant towards a particular answer.
- Double-barrelled: asking two things at once.
- Ambiguous: unclear or open to different interpretations.
- Too sensitive without proper ethical safeguards.
Interviews
An interview is a verbal self-report method where a researcher asks questions and records responses.
There are three main interview types:
- Structured interview: fixed questions in a fixed order. Easier to compare, but less flexible.
- Semi-structured interview: fixed key questions plus follow-up questions. Good balance of consistency and depth.
- Unstructured interview: more like a guided conversation. Rich detail, but harder to analyse and replicate.
Researcher effects
Researcher effects occur when the researcher’s behaviour, appearance, tone or expectations influence how participants respond.
In social psychology, researcher effects matter because participants may try to appear moral, tolerant or obedient. This is linked to social desirability bias, where people give answers that make them look good.
Reducing researcher effects
Use anonymous questionnaires, neutral wording, standardised instructions and, where possible, avoid having the researcher watch participants complete sensitive items.
Open, closed and ranked-scale questions
Open questions
An open question allows participants to answer in their own words.
Example: “Why do you think people obey authority figures?”
Open questions produce qualitative data, meaning non-numerical data such as words, explanations or themes.
Closed questions
A closed question gives fixed response options.
Example: “Have you ever obeyed an instruction you disagreed with? Yes / No”
Closed questions produce quantitative data, meaning numerical data that can be counted, scored or statistically analysed.
Ranked-scale questions
A ranked scale question asks participants to choose from ordered options.
Example: “Rate how obedient you think you are from 1 = not obedient to 5 = very obedient.”
These are useful in the social psychology practical because they let you compare scores between groups.
Treating every number as equally strong evidence
A 1-to-5 rating scale is often ordinal data: the scores are ordered, but the gap between 1 and 2 may not feel exactly equal to the gap between 4 and 5. Be cautious when interpreting tiny differences in means.
Writing alternate hypotheses
An alternate hypothesis is a testable prediction that there will be a difference, relationship or association in the data. In your social psychology practical, the focus is usually a difference between two conditions or groups.
A null hypothesis predicts that there will be no difference, relationship or association beyond chance.
Directional and non-directional hypotheses
A directional hypothesis predicts the specific direction of the effect, such as “Group A will score higher than Group B.” A non-directional hypothesis predicts a difference but not which group will score higher.
Writing a difference hypothesis
A student investigates whether people show in-group favouritism when rating two teams.
- Identify the two sets of data being compared: ratings given to the participant’s in-group and ratings given to the out-group.
- Decide whether the prediction is directional. If social identity theory predicts favouritism towards the in-group, a directional hypothesis is appropriate.
- Write the alternate hypothesis clearly: “Participants will give higher favourability ratings to their in-group than to the out-group.”
- Write the null hypothesis as the comparison point: “There will be no difference in favourability ratings given to the in-group and out-group.”
Sampling techniques
A sample is the group of participants who take part in your study. The target population is the wider group you want to generalise to.
Random sampling
In random sampling, every member of the target population has an equal chance of being selected. This can reduce researcher bias, but it needs a full list of the population, called a sampling frame.
Stratified sampling
In stratified sampling, the researcher identifies important subgroups, such as year group or gender, and samples from each in proportion to the target population. This can improve representativeness, but it is time-consuming.
Volunteer sampling
In volunteer sampling, participants choose to take part, often after seeing an advert. It is easy to organise, but may attract people who are especially interested or confident.
Opportunity sampling
In opportunity sampling, the researcher uses people who are available at the time. It is quick and common in school practicals, but often unrepresentative.
Sampling affects validity
A study can have excellent questions and careful analysis, but if the sample is biased, it becomes harder to generalise the findings to wider society.
Analysing quantitative data
Quantitative data is numerical. In your practical, this might be obedience ratings, favourability scores or agreement ratings.
Measures of central tendency
A measure of central tendency gives a typical score.
- Mean: add all scores and divide by the number of scores. Sensitive to extreme values.
- Median: the middle score when scores are ordered. Useful when data are skewed.
- Mode: the most common score. Useful for categories.
The mean is:
xˉ=∑xn\bar{x} = \frac{\sum x}{n}xˉ=n∑xMeasures of dispersion
A measure of dispersion shows how spread out the scores are.
- Range: highest score minus lowest score. Simple, but affected by outliers.
- Standard deviation: shows how much scores typically vary around the mean. A larger standard deviation means scores are more spread out.
One common sample standard deviation formula is:
s=∑(x−xˉ)2n−1s = \sqrt{\frac{\sum (x-\bar{x})^2}{n-1}}s=n−1∑(x−xˉ)2Calculating descriptive statistics
A questionnaire gives obedience self-rating scores for four participants: 4, 6, 7 and 7.
- Calculate the mean by adding the scores and dividing by the number of scores: xˉ=4+6+7+74=6\bar{x} = \frac{4+6+7+7}{4} = 6xˉ=44+6+7+7=6.
- Calculate the range by subtracting the lowest score from the highest score: 7−4=37 - 4 = 37−4=3.
- Work out each deviation from the mean: -2, 0, 1 and 1.
- Square the deviations and add them: 4+0+1+1=64 + 0 + 1 + 1 = 64+0+1+1=6.
- Divide by n−1n-1n−1 and square root the answer: s=63≈1.41s = \sqrt{\frac{6}{3}} \approx 1.41s=36≈1.41.
Frequency tables, bar charts and histograms
A frequency table shows how often each score or category occurs. This is useful before drawing a graph.
A bar chart is used for separate categories or groups, such as male/female groups or in-group/out-group ratings. Bars should not touch because the categories are separate.
A histogram is used for continuous data grouped into intervals. The bars touch because the scale is continuous.
Using a histogram for categories
If your x-axis has separate groups such as “in-group” and “out-group”, use a bar chart, not a histogram.
Normal and skewed distributions
A normal distribution is symmetrical and bell-shaped. In a normal distribution, the mean, median and mode are close together.
A skewed distribution is uneven, with a long tail at one end. In a positive skew, the tail is towards high scores. In a negative skew, the tail is towards low scores.
Skew matters because extreme scores can pull the mean away from the typical participant. In skewed questionnaire data, the median may sometimes represent the group better than the mean.
Analysing qualitative data using thematic analysis
Thematic analysis is a method for identifying patterns or themes in qualitative data.
You might use it for answers to open questions such as “Why do you think people favour their own group?”
The process usually involves:
- Reading all responses carefully.
- Coding meaningful words or phrases.
- Grouping similar codes into themes.
- Naming the themes.
- Selecting short quotes as evidence.
Turning comments into themes
Participants explain why they rated their in-group more positively.
- Code repeated ideas in the responses: “they are like me,” “we support the same team,” and “I trust them more” could be coded as shared identity.
- Group similar codes into a broader theme: shared identity, loyalty and trust could form a theme called in-group connection.
- Link the theme back to social psychology: the theme supports social identity theory because participants describe favouring people who belong to the same group.
Improving thematic analysis
Ask another researcher to code some responses and compare themes. This can improve reliability because the analysis is less dependent on one person’s interpretation.
Inferential tests: choosing and interpreting them
Your social practical mainly requires descriptive analysis, but A-Level research methods also expects you to understand inferential testing.
An inferential test helps decide whether a pattern in the sample is statistically significant, meaning unlikely to be due to chance.
Use the test that matches the research question and design:
- Mann-Whitney U: difference between two independent groups.
- Wilcoxon signed-ranks: difference between two related conditions or matched pairs.
- Spearman’s rho: correlation between two co-variables.
- Chi-square: association between categorical variables.
The usual significance level is p≤.05p \le .05p≤.05. A stricter level is p≤.01p \le .01p≤.01, which reduces the risk of a false positive. A more lenient level is p≤.10p \le .10p≤.10, sometimes used in exploratory research.
Type I and Type II errors
A Type I error is rejecting the null hypothesis when it is actually true. A Type II error is failing to reject the null hypothesis when the alternate hypothesis is actually true.
For one-tailed tests, use a directional hypothesis. For two-tailed tests, use a non-directional hypothesis.
Choosing and interpreting a difference test
A researcher compares obedience ratings from two separate groups and uses a non-directional hypothesis.
- Identify the design: the two groups contain different participants, so the data are from independent groups.
- Choose the test: Mann-Whitney U is appropriate because the researcher is testing for a difference between two independent groups.
- Choose the tail: because the hypothesis only predicts “a difference,” not which group scores higher, use a two-tailed critical value.
- Compare observed and critical values: for Mann-Whitney U, the result is significant when Uobs≤UcritU_\text{obs} \le U_\text{crit}Uobs≤Ucrit.
- Interpret the result: if the result is significant at p≤.05p \le .05p≤.05, reject the null hypothesis, but do not claim the finding is “proven.”
Observed vs critical values
For Mann-Whitney U and Wilcoxon signed-ranks, the observed value usually needs to be equal to or smaller than the critical value. For Spearman’s rho and chi-square, it usually needs to be equal to or larger than the critical value.
Ethics and the BPS Code of Ethics and Conduct
The British Psychological Society Code of Ethics and Conduct (2009) guides psychologists to protect participants and act responsibly.
Key ethical issues include:
- Informed consent: participants should know what they are agreeing to.
- Deception: misleading participants should be avoided unless justified.
- Right to withdraw: participants can leave and remove their data.
- Protection from harm: avoid distress, embarrassment or pressure.
- Confidentiality: personal data should not be identifiable.
- Debrief: explain the study afterwards and provide support if needed.
Risk management means thinking ahead: What could upset participants? What data need protecting? What will you do if someone becomes distressed?
Classic and contemporary social psychology studies show why ethics matter. Sherif et al.’s Robbers Cave study (1954/1961) involved boys in intergroup conflict, raising issues of consent and deception. Burger’s partial replication of Milgram (2009) used stronger safeguards, including screening, a lower stopping point and the right to withdraw.
Key question: reducing prejudice in society
A key question should be discussed as a real contemporary issue, not just an academic debate.
One suitable key question is: How can social psychology be used to reduce prejudice in situations such as crowd behaviour or rioting?
Sherif et al. (1954/1961) showed that competition between groups can increase hostility, while shared superordinate goals can reduce conflict. A superordinate goal is a goal that can only be achieved if groups cooperate.
Social identity theory, developed by Tajfel and Turner (1979), explains that people categorise themselves into in-groups and out-groups. This can create favouritism towards the in-group and negative stereotypes of the out-group.
In real life, this suggests prejudice may be reduced by:
- Creating shared goals between groups.
- Encouraging positive contact under equal-status conditions.
- Reducing “us versus them” language.
- Promoting a wider shared identity, such as community membership.
AO3 evaluation matters here. These ideas have practical value in schools, policing, sport and community work. However, real-world prejudice is affected by history, poverty, media, politics and power, so social psychology is useful but not a complete solution.
Your practical investigation
A suitable practical could be: a questionnaire investigating in-group favouritism.
You could ask participants to rate their own group and another group using closed ranked-scale questions, then include open questions asking why they gave those ratings.
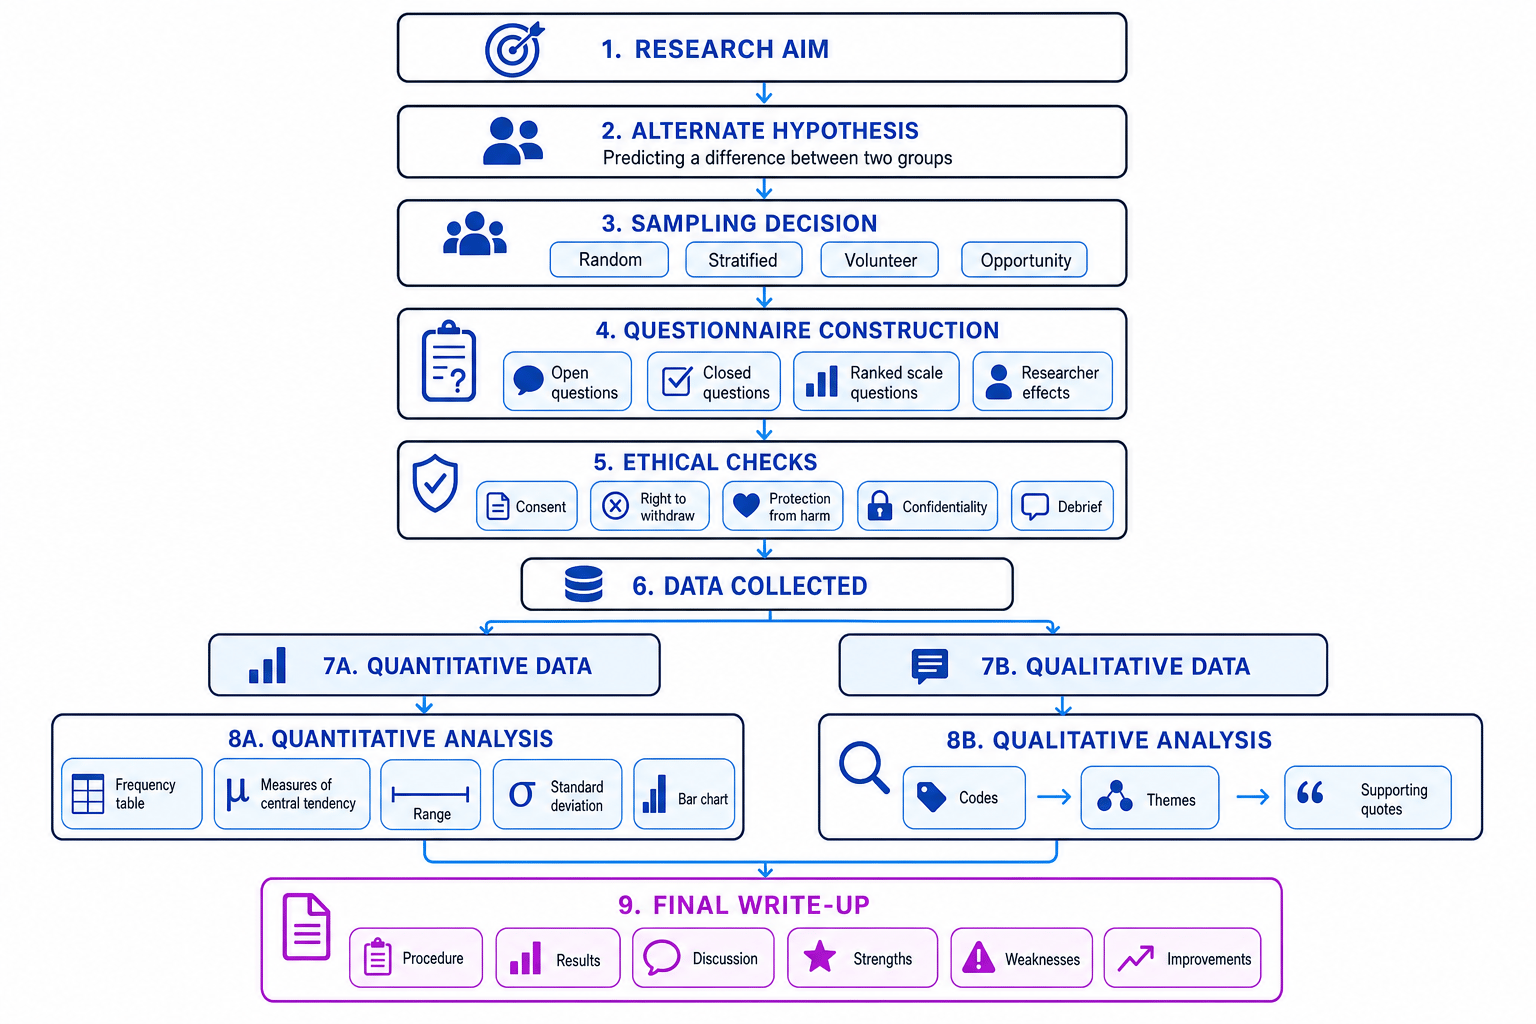
Your write-up should include:
- Procedure: what participants did, what materials were used, how ethics were handled.
- Results: frequency table, measures of central tendency, range, standard deviation where appropriate, bar chart and thematic analysis.
- Discussion: what the findings suggest, links to social psychology, strengths, weaknesses and improvements.
Strengths of a questionnaire include standardisation, easy comparison and quick data collection. Weaknesses include social desirability bias, limited depth in closed questions and possible sampling bias.
Good improvements include piloting the questionnaire, using a larger or stratified sample, improving anonymity, adding clearer response scales and using another researcher to check qualitative themes.
In the exam
- Link methods answers to the practical: questionnaire construction, sampling, ethics, quantitative analysis and thematic analysis.
- For evaluation, be specific: name the bias or issue, explain its effect, then suggest a realistic improvement.
- When choosing a statistical test, identify the design first: independent groups, related data, correlation or categorical association.
Check yourself
- What is the difference between an open question, a closed question and a ranked-scale question?
- Why might opportunity sampling reduce the generalisability of a social psychology practical?
- How would you decide whether to use Mann-Whitney U, Wilcoxon, Spearman’s rho or chi-square?