What a box plot shows
What a box plot shows
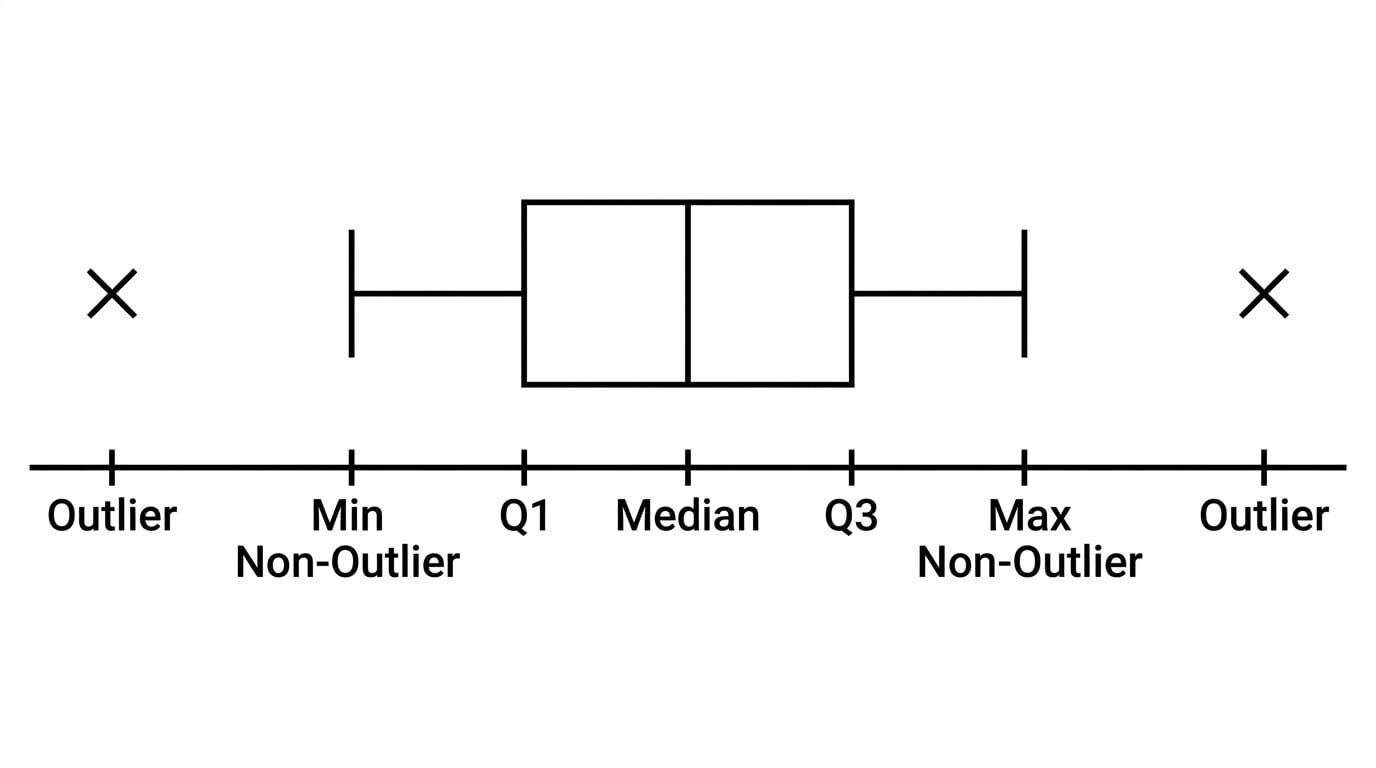 A box plot summarises a data set on a number line using the lower quartile Q1Q_1Q1, the median, the upper quartile Q3Q_3Q3, and the whiskers. The whiskers reach the smallest and largest non-outlier values, while any outliers are plotted separately as crosses.