What a histogram shows
What a histogram shows
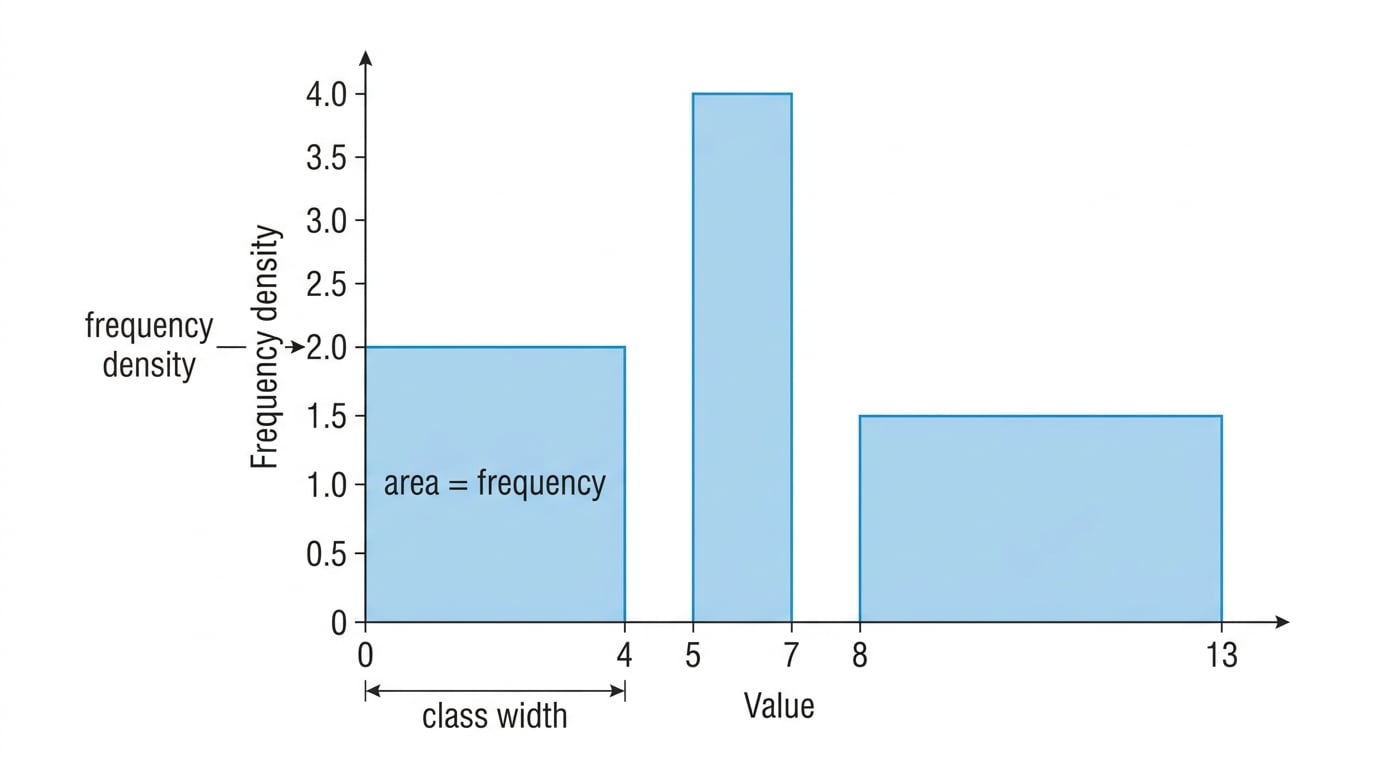
A histogram is used for grouped numerical data, especially when class widths are different. The bars touch because the data are continuous or treated as continuous.
3.4 Histograms Lesson
Step-by-step lessons on Edexcel AS Level Maths 3.4 Histograms. Each one builds up to exam-style questions. Build fluency in the core algebra, surds and trigonometry topics early, since they underpin the calculus, statistics and mechanics content that follows.