Revision notes for Edexcel AS Level Maths Data Collection. Open each subtopic for explanations, worked examples, and summaries of Populations and Samples, Sampling, Non-Random Sampling, Types of Data, and The Large Data Set. Written against the Edexcel AS Level Maths (8MA0) specification, so the content matches what's examinable rather than general Maths background.
Data Collection
What you'll learn
- How to describe random, stratified, systematic, and non-random sampling methods.
- How to calculate the correct number to sample from each group.
- How to explain when a method is not suitable.
- How to write exam-style descriptions that are clear enough for full marks.
The big picture: population, sample and census
In statistics, you often want to find out something about a large group, but it may be too expensive, slow, or unrealistic to ask everyone. So you collect data from a smaller group instead.
Definition
Population, sample and census
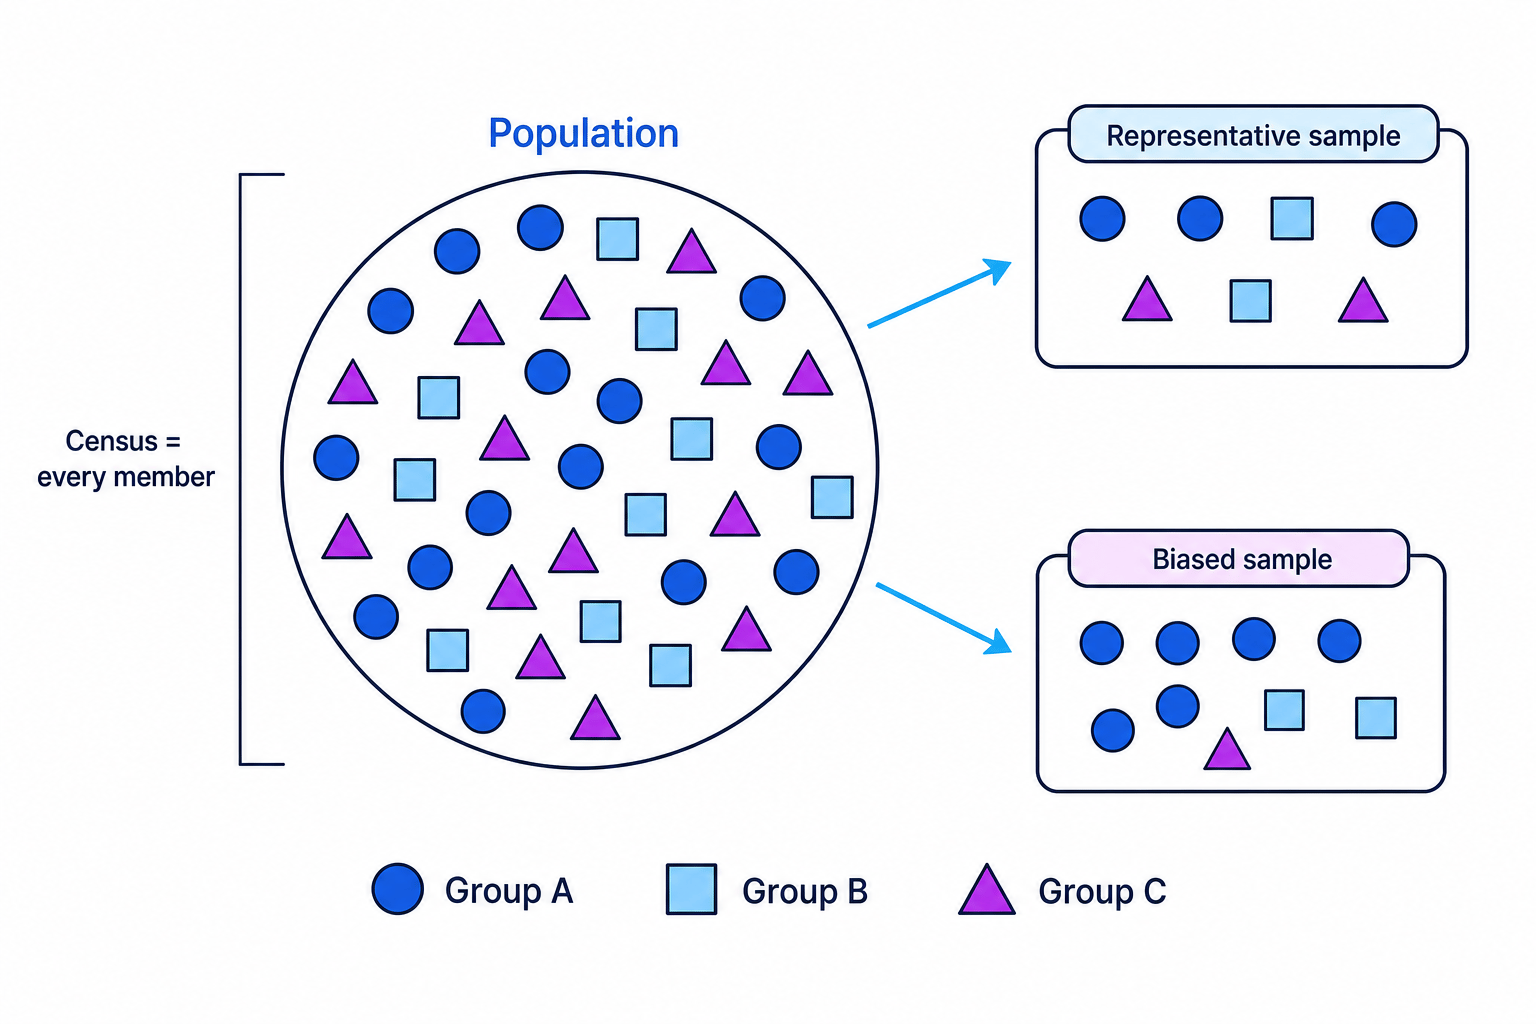
- The population is the whole group you are interested in.
- A sample is a smaller group chosen from the population.
- A census collects data from every member of the population.
A good sample should be representative, meaning it reflects the population fairly. If the sample is not representative, your results may be biased, meaning they systematically favour certain outcomes.
Example
Identifying the population and sample
A sports centre wants to know how satisfied its 520 members are. The manager asks 40 members to complete a questionnaire.
-
The population is all 520 members of the sports centre.
-
The sample is the 40 members who complete the questionnaire.
-
A census would mean asking all 520 members, not just 40.
-
The sample may be easier to collect, but the manager must choose it carefully so it represents the whole membership.
Key Idea
Why sampling matters
A sample saves time and money, but it is only useful if the method used to choose it avoids obvious bias.
Sampling frames and simple random sampling
Before you can choose a random sample, you usually need a list of everyone in the population.
Definition
Sampling frame
A sampling frame is a list of all members of the population from which a sample can be chosen.
A simple random sample is a sample where every possible sample of that size has an equal chance of being selected. In practice, this is often done by numbering the members of the sampling frame and using a random number generator.
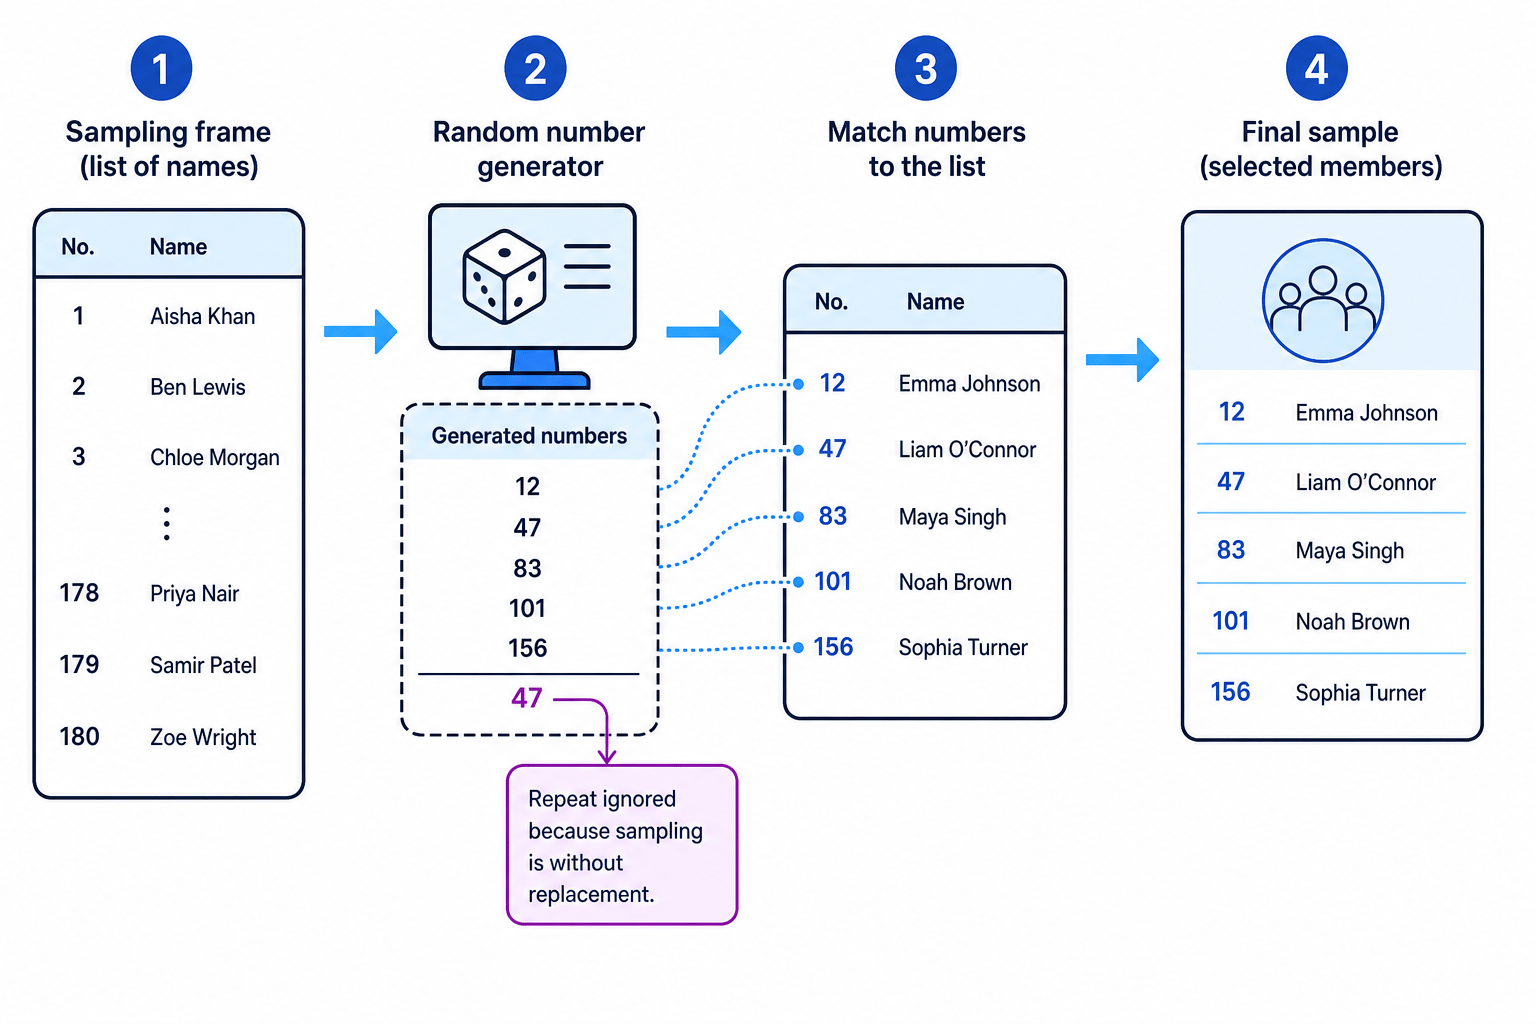
Sampling is usually done without replacement, meaning once someone has been selected, they cannot be selected again.
Example
Taking a simple random sample
A club has 180 members. The secretary wants a random sample of 15 members.
-
Write a list of all 180 members. This is the sampling frame.
-
Number the members from 1 to 180.
-
Use a random number generator to choose 15 different numbers between 1 and 180.
-
Select the members with those numbers.
-
If a number is repeated, ignore the repeat and generate another number, because the sample is taken without replacement.
Common Mistake
Saying 'choose randomly' without explaining how
In exam answers, do not just write “pick 15 at random”. Say that you number the sampling frame and use random numbers. That shows the method clearly.
Stratified random sampling
Sometimes the population is naturally split into groups, such as year groups, age groups, departments, or species. These groups are called strata.
Definition
Stratified random sample
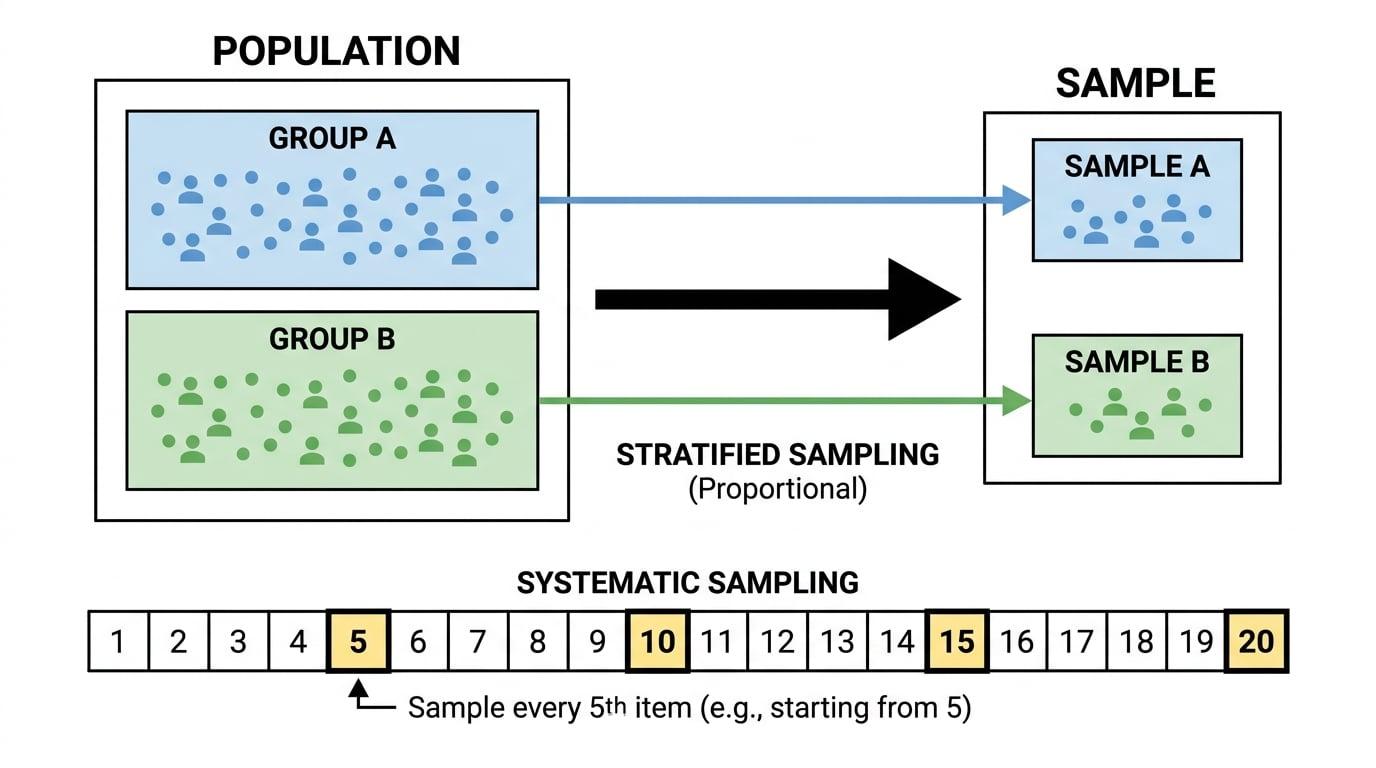
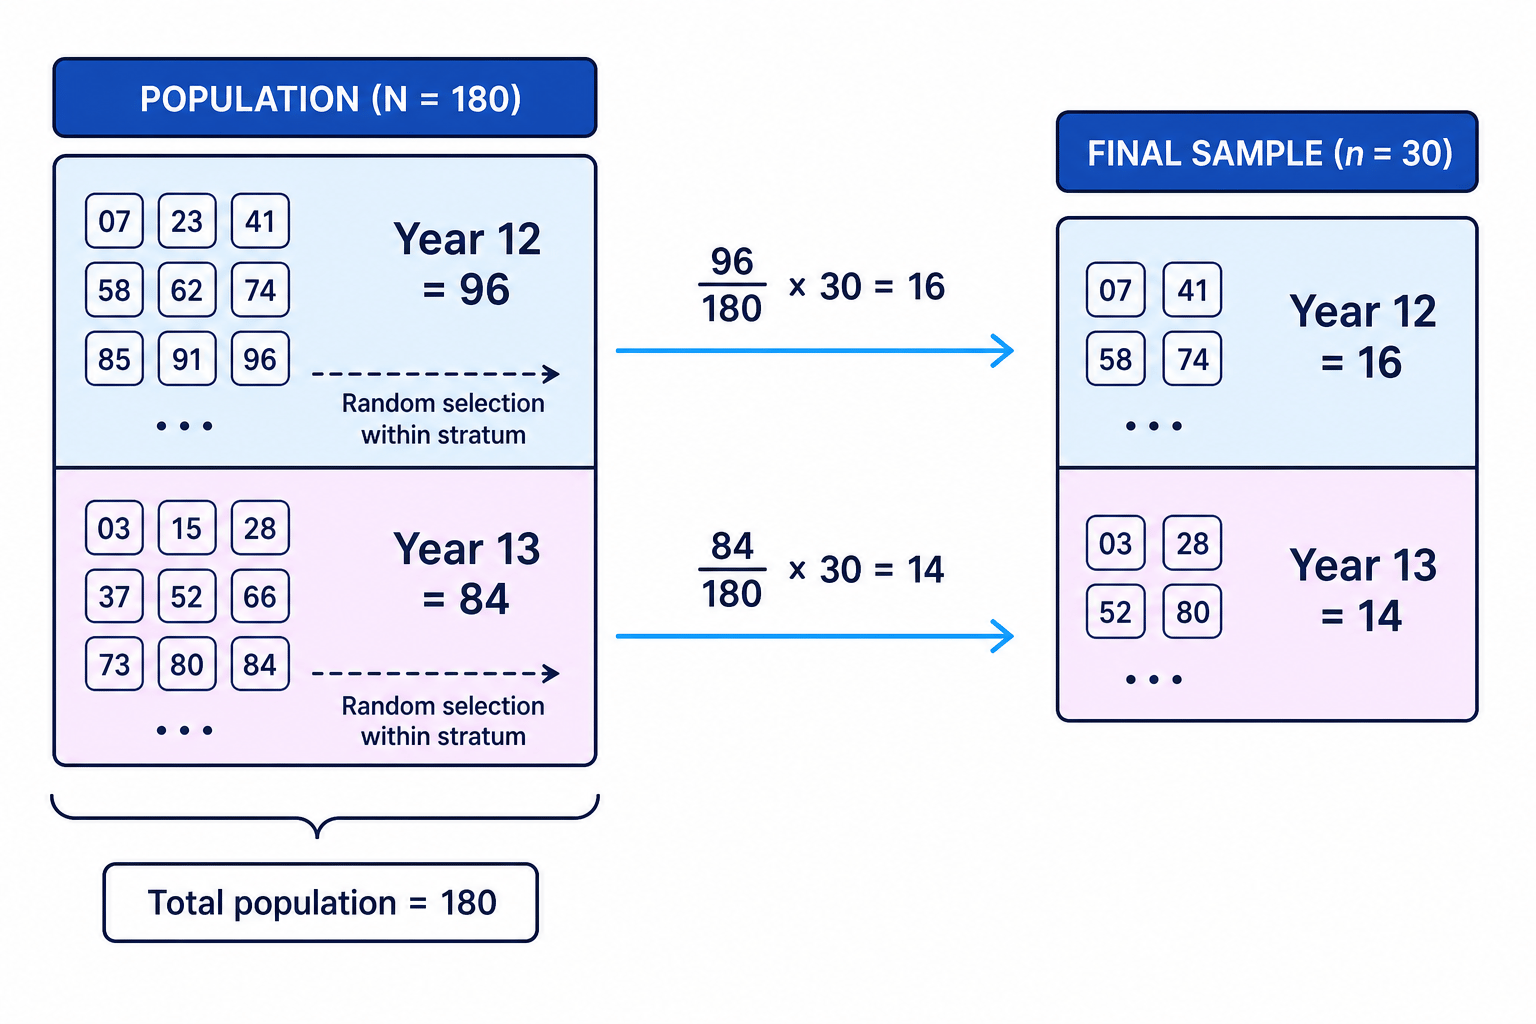
A stratified random sample divides the population into strata, then takes a random sample from each stratum in proportion to its size.
The formula is:
sample from stratum=stratum sizepopulation size×overall sample size\text{sample from stratum}=\frac{\text{stratum size}}{\text{population size}}\times \text{overall sample size}sample from stratum=population sizestratum size×overall sample sizeThis is useful when you want each group to be fairly represented.
Example
Choosing a stratified sample by year group
A college has 96 students in Year 12 and 84 students in Year 13. A teacher wants a stratified sample of 30 students.
-
Find the total number of students.
96+84=18096+84=18096+84=180 -
Calculate the number of Year 12 students in the sample.
96180×30=16\frac{96}{180}\times 30=1618096×30=16 -
Calculate the number of Year 13 students in the sample.
84180×30=14\frac{84}{180}\times 30=1418084×30=14 -
Number all Year 12 students and use a random number generator to choose 16 of them.
-
Number all Year 13 students and use a random number generator to choose 14 of them.
-
The final sample contains 16 Year 12 students and 14 Year 13 students, giving 30 students altogether.
Tip
Check the total
After rounding or calculating stratum sizes, always check that the sample sizes add up to the required total.
Common Mistake
Forgetting the random part
A stratified sample is not just “take some from each group”. You must choose randomly within each stratum.
Systematic sampling
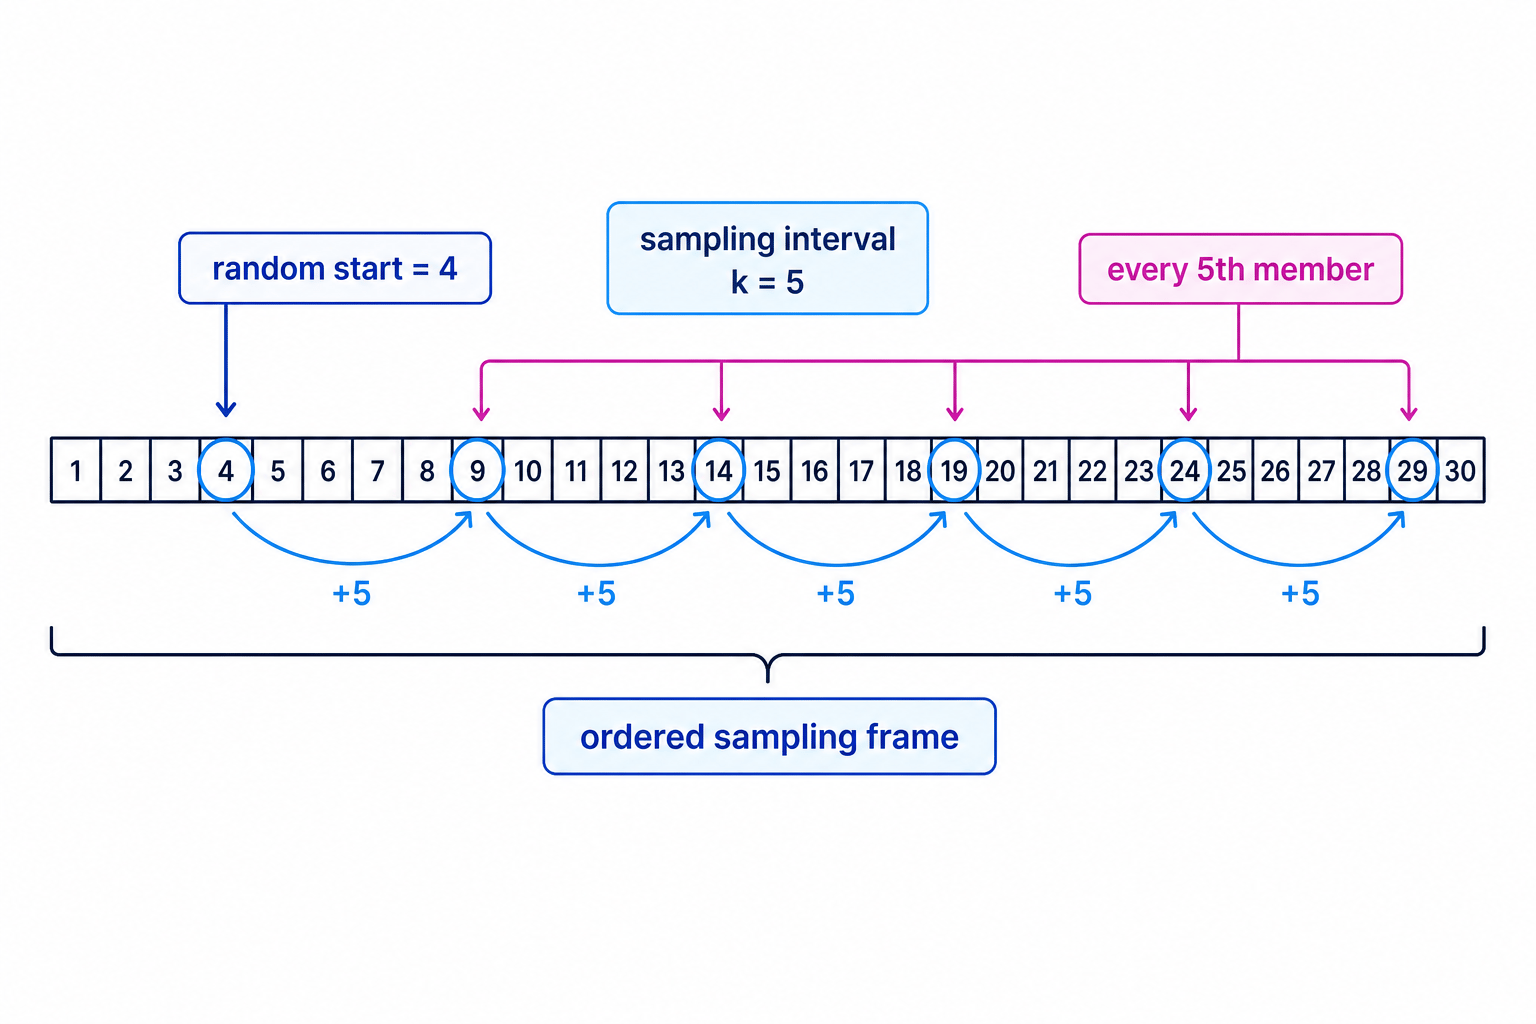
A systematic sample chooses members at regular intervals from an ordered list.
Definition
Systematic sampling
In systematic sampling, you choose a random starting point, then select every kkkth member of the sampling frame, where kkk is the sampling interval.
If the population size is NNN and the sample size is nnn, then:
k=Nnk=\frac{N}{n}k=nNFor AS Statistics questions, the interval often works out as a whole number.
Example
Taking a systematic sample of employees
A business has 150 employees and wants a sample of 30 employees using systematic sampling.
-
Find the sampling interval.
k=15030=5k=\frac{150}{30}=5k=30150=5 -
Put the 150 employees in a numbered list from 1 to 150.
-
Choose a random starting number from 1 to 5. For example, suppose the random start is 4.
-
Select employee numbers 4, 9, 14, 19, and continue adding 5 each time.
-
Keep going until 30 employees have been selected.
Common Mistake
Starting at 1 automatically
If you always start with the first person, the sample is not properly random. You need a random start between 1 and the sampling interval.
When stratified random sampling is not possible
Stratified random sampling needs accurate group sizes and a way to randomly choose individuals from each group. Sometimes you only have estimates, or you cannot list every individual.
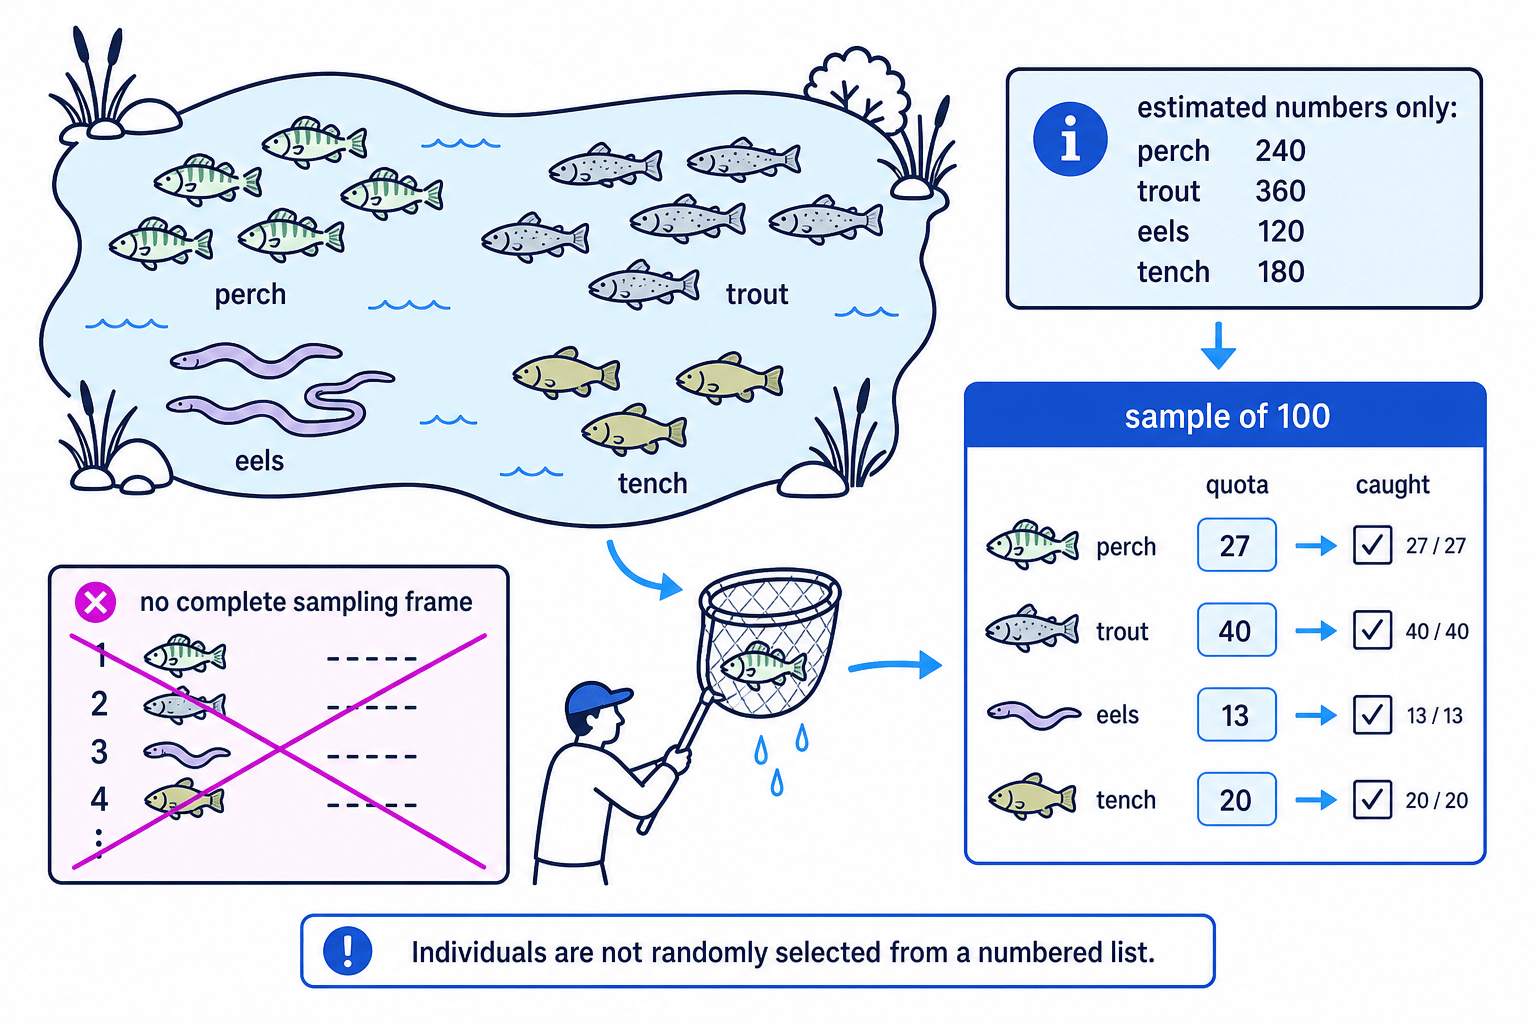
For example, in a lake, you may have estimated numbers of each type of fish, but no complete list of individual fish. That means there is no sampling frame, so true stratified random sampling is not possible.
A useful alternative is quota sampling.
Definition
Quota sampling
Quota sampling is a non-random method where the researcher decides how many individuals to collect from each group, usually in proportion to estimated group sizes.
Example
Using quotas when only estimates are available
A pond is estimated to contain 240 perch, 360 trout, 120 eels and 180 tench. A researcher wants a sample of 100 fish that fairly represents the estimated populations.
-
Stratified random sampling is not suitable because the fish are not in a numbered sampling frame, and the population sizes are only estimates.
-
Find the estimated total number of fish.
240+360+120+180=900240+360+120+180=900240+360+120+180=900 -
Calculate proportional quotas for each type of fish.
perch:240900×100≈26.7trout:360900×100=40eels:120900×100≈13.3tench:180900×100=20\begin{aligned} \text{perch} &: \frac{240}{900}\times 100 \approx 26.7 \\ \text{trout} &: \frac{360}{900}\times 100 = 40 \\ \text{eels} &: \frac{120}{900}\times 100 \approx 13.3 \\ \text{tench} &: \frac{180}{900}\times 100 = 20 \end{aligned}perchtrouteelstench:900240×100≈26.7:900360×100=40:900120×100≈13.3:900180×100=20 -
Choose quotas that add to 100, such as 27 perch, 40 trout, 13 eels and 20 tench.
-
Catch fish and record them until each quota has been filled.
-
The method is quota sampling, because the sample is chosen to match the estimated proportions but is not randomly selected from a full sampling frame.
Common Mistake
Quota sampling is not random
Quota sampling can give fair-looking proportions, but it can still be biased because the individuals within each group are not chosen randomly.
Opportunity sampling and other non-random methods
Not every sampling method is random. In non-random sampling, not every member of the population has a known or equal chance of being chosen.
The most common non-random methods you need are:
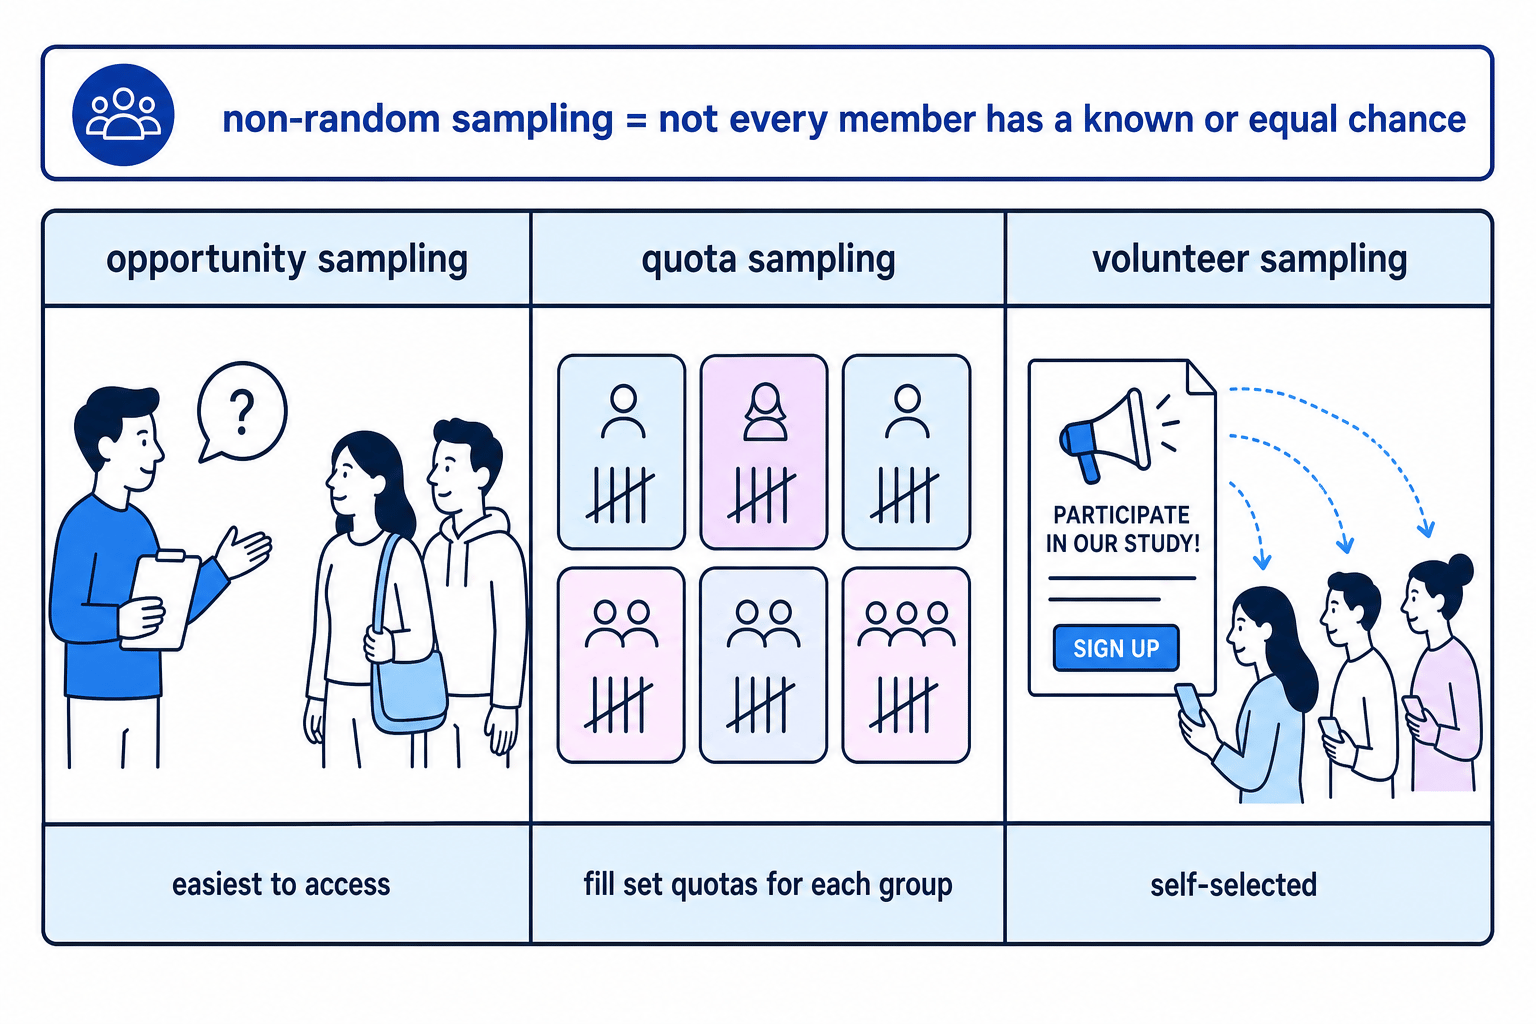
- Opportunity sampling, also called convenience sampling: choose people who are easiest to access.
- Quota sampling: choose people or items until set quotas are filled.
- Volunteer sampling, also called self-selected sampling: people choose to take part, for example by responding to an advert.
Example
Recognising opportunity sampling
A student wants to investigate how long people take to travel to a leisure centre. She stands near the entrance in the afternoon and asks the first 35 people who arrive.
-
This is opportunity sampling, because she uses the people who are easiest to access at that time and place.
-
The sample may be biased because it only includes people arriving in the afternoon.
-
An alternative non-random method would be quota sampling.
-
For quota sampling, she could decide quotas for different age groups, such as teenagers, adults and over-60s.
-
She would then ask people until each age-group quota was filled.
Tip
Spotting opportunity sampling
If the sample is made from “the first people available”, “people nearby”, or “people passing by”, it is usually opportunity sampling.
Writing good descriptions
For questions asking you to “describe how” a sample could be taken, your answer should be practical. Imagine someone following your instructions exactly.
For random methods, include:
- the sampling frame;
- numbering the members;
- using random numbers;
- avoiding repeats if needed.
For stratified sampling, also include:
- the size of each stratum;
- the proportional calculation;
- random selection within each stratum.
For systematic sampling, include:
- the sampling interval;
- a random starting point;
- selecting every kkkth member.
Example
Choosing the correct description
A company has 240 staff and wants a systematic sample of 40 staff.
-
Calculate the sampling interval.
k=24040=6k=\frac{240}{40}=6k=40240=6 -
Number the staff from 1 to 240.
-
Choose a random starting number from 1 to 6.
-
Select that person and then every 6th person after that.
-
Continue until 40 staff have been selected.
Exam technique
In the exam
-
Name the sampling method clearly if the question asks for it.
-
For random methods, always mention a sampling frame, numbering, and a random number generator or random start.
-
For stratified questions, calculate each group size and check the final sample total.
-
If a method is impossible, explain why using words like “no sampling frame”, “only estimates”, or “cannot randomly identify individuals”.
Self review
Check yourself
- Can you explain the difference between stratified random sampling and quota sampling?
- If 200 people are listed and you need a systematic sample of 25, what is the sampling interval?
- Why might asking the first 50 people through a door give a biased sample?

Recap questions
Test yourself with 5 quick questions on this guide. Answer them all correctly to complete it.
You've reached the end
Test yourself on this topic, or move on to the next guide.
How was this guide?