Revision notes for Edexcel AS Level Maths Velocity-Time Graphs. Open the guide for explanations and worked examples. Written against the Edexcel AS Level Maths (8MA0) specification, so the content matches what's examinable rather than general Maths background.
Velocity-Time Graphs
What you'll learn
- How a velocity-time graph represents a journey.
- How the gradient (slope) gives acceleration.
- How the area under the graph gives distance travelled.
- How to combine graph facts to find missing times, speeds and distances.
The basic picture: shape tells a story
Velocity-time graphs are especially useful for journeys where the motion happens in a straight line. The horizontal axis is time, and the vertical axis is velocity.
Definition
Key words for velocity-time graphs
-
A velocity-time graph plots velocity on the vertical axis against time on the horizontal axis.
-
Velocity is speed with a chosen direction. In these notes, the velocity stays at or above zero, so its size is the speed.
-
Acceleration is the rate of change of velocity with time. Constant acceleration means this rate stays the same, so the graph section is a straight line.
-
Deceleration means the speed is decreasing. Its acceleration is negative if the forward direction is positive; its magnitude is the positive size.
-
From rest means the initial velocity is 0 m s^-1.
-
Distance is the total length travelled. Displacement is the change in position, including direction.
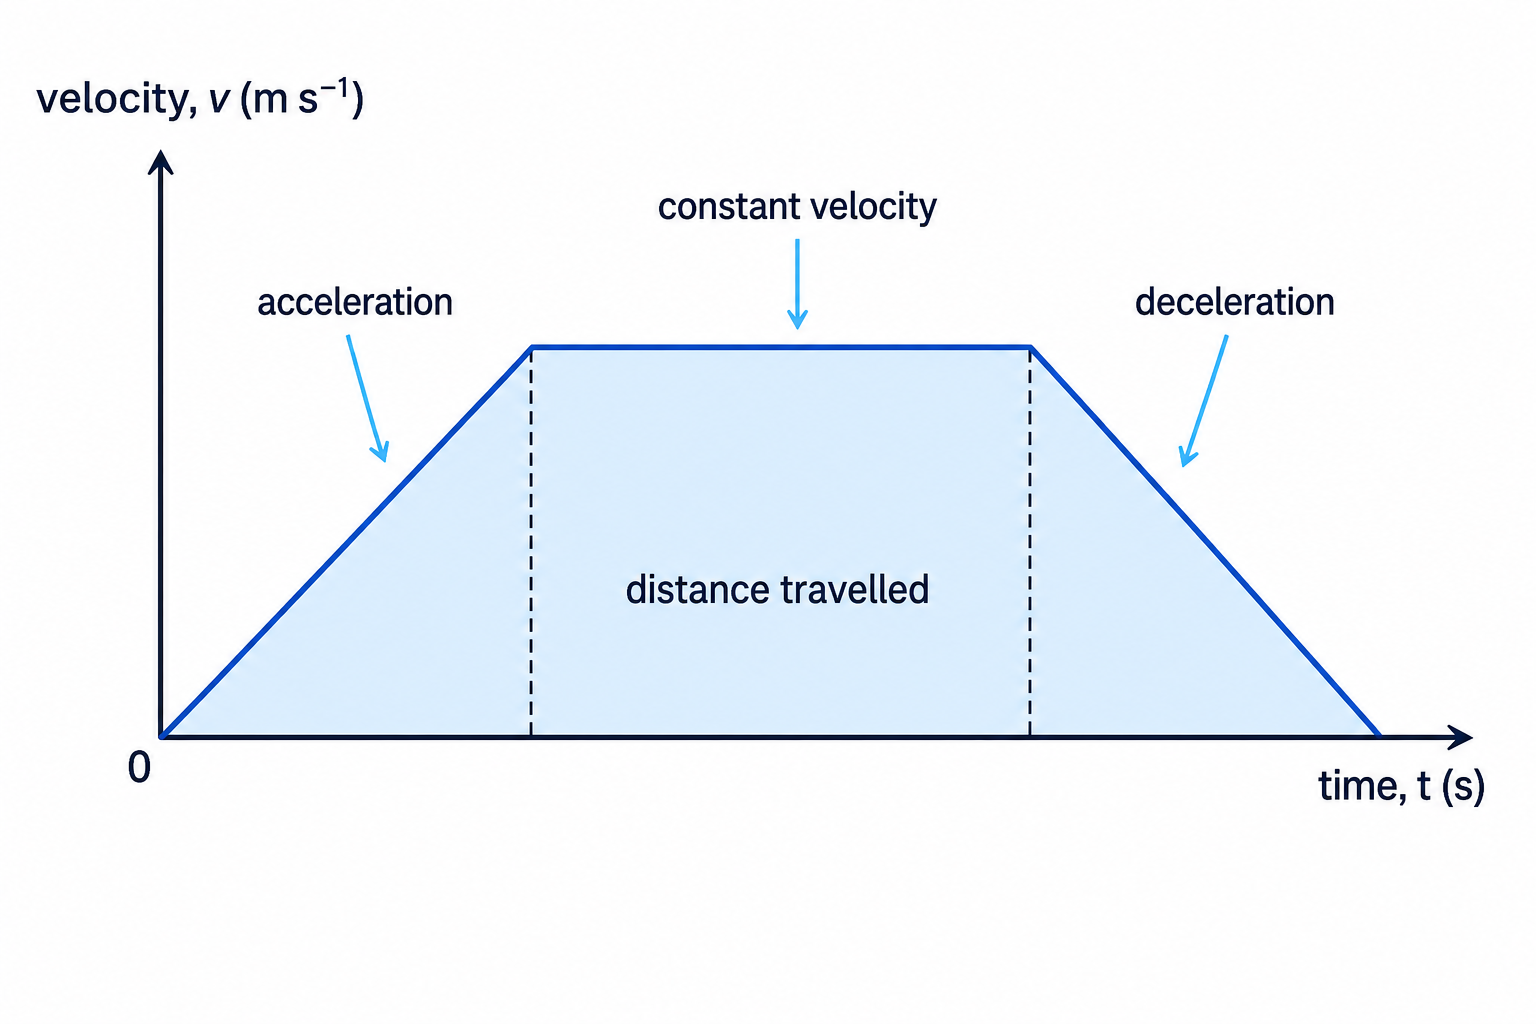
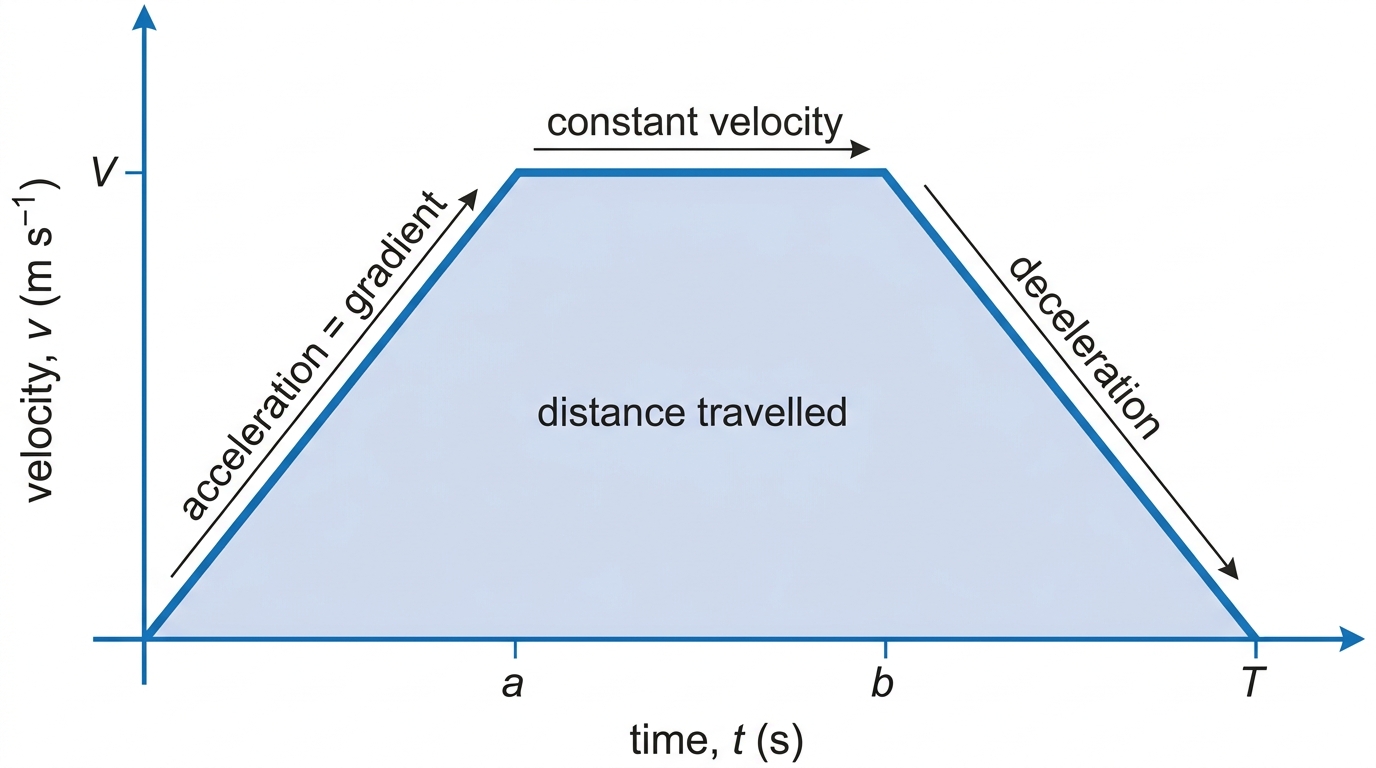
A typical journey might involve speeding up, moving at constant velocity, then slowing down to rest.
Example
Reading the shape of a journey
A bus starts from rest, accelerates uniformly, travels at constant velocity, then decelerates uniformly to rest. Describe the shape of its velocity-time graph.
-
Since the bus starts from rest, the graph begins at the origin.
-
Uniform acceleration is shown by a straight line sloping upwards.
-
Constant velocity is shown by a horizontal line.
-
Uniform deceleration to rest is shown by a straight line sloping down to the time axis.
Gradient: finding acceleration
The gradient of a line means its slope: vertical change divided by horizontal change.
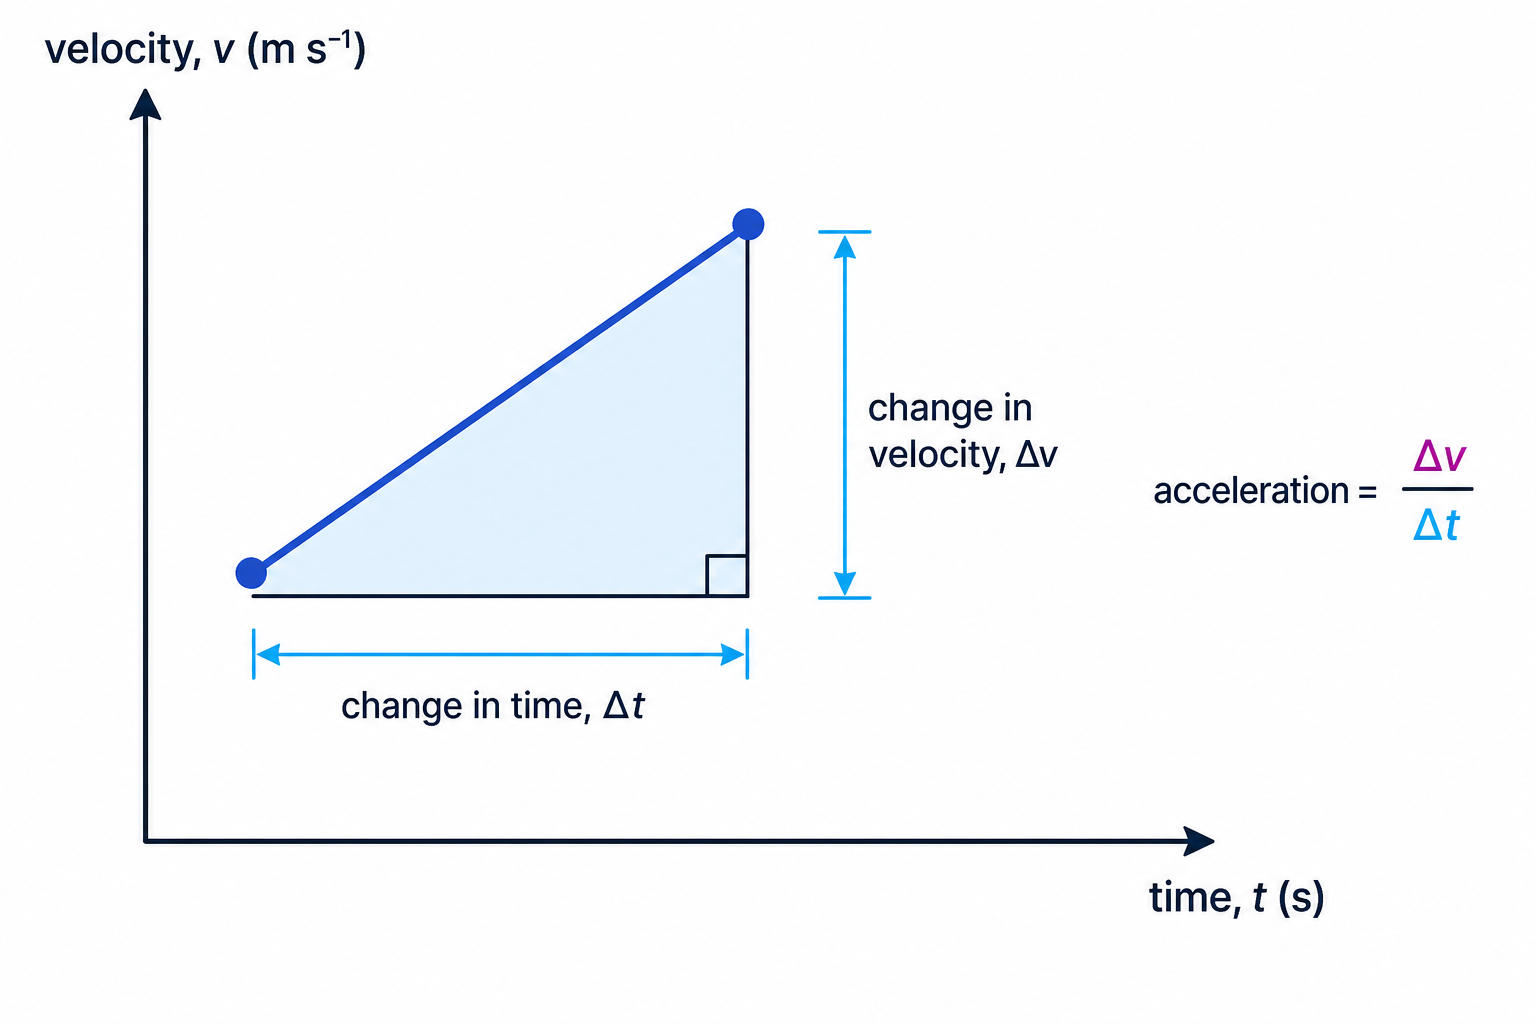
On a velocity-time graph, the vertical change is change in velocity, and the horizontal change is change in time, so:
a=change in velocitychange in timea = \frac{\text{change in velocity}}{\text{change in time}}a=change in timechange in velocityThe units of acceleration are m s^-2.
Key Idea
Gradient tells you the acceleration
-
A rising straight line means positive acceleration.
-
A horizontal line means zero acceleration.
-
A falling straight line means negative acceleration, usually described as deceleration.
Example
Finding acceleration from a graph description
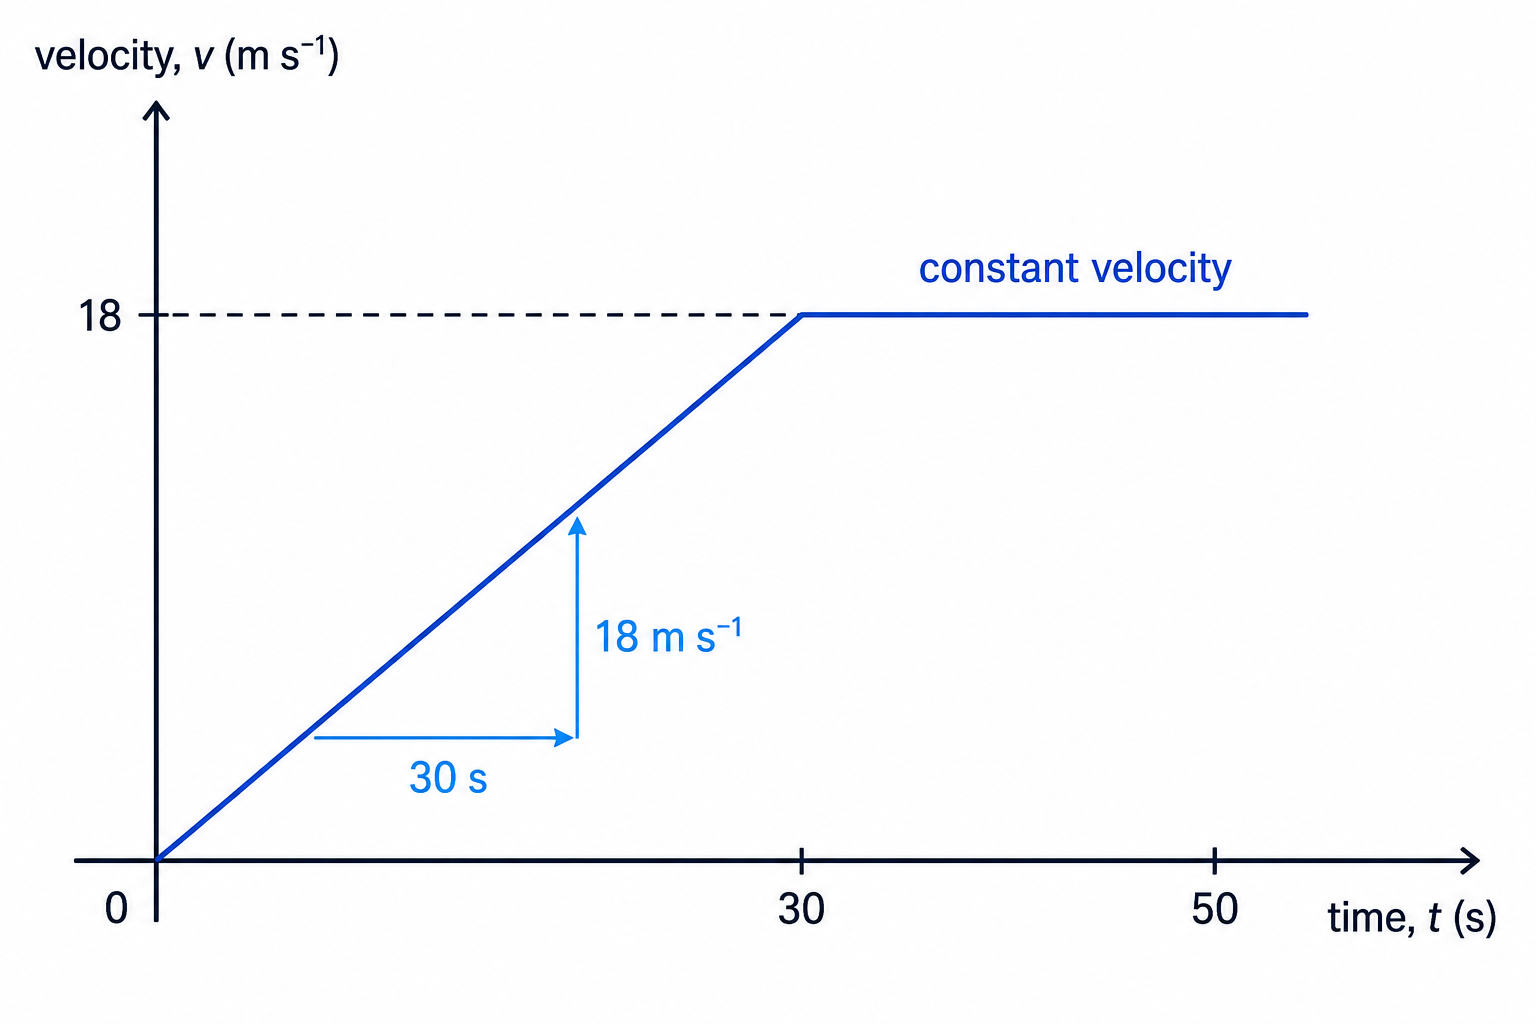
A tram moves from rest to 18 m s^-1 uniformly in 30 s, then continues at 18 m s^-1 for another 20 s. Find its acceleration in each part.
-
“From rest” means the starting velocity is 0 m s^-1.
-
For the first part, use change in velocity divided by change in time:
a=18−030=0.6a = \frac{18 - 0}{30} = 0.6a=3018−0=0.6 -
The acceleration for the first 30 s is 0.6 m s^-2.
-
During the constant-velocity part, the graph is horizontal, so the acceleration is 0 m s^-2.
Common Mistake
Using the height instead of the gradient
The height of the graph gives velocity, not acceleration. Acceleration comes from the slope of the line.
Area: finding distance travelled
The other big idea is area.
displacement=area under the velocity-time graph\text{displacement} = \text{area under the velocity-time graph}displacement=area under the velocity-time graphIf the whole graph is above the time axis, displacement and distance are the same.
The common shapes are:
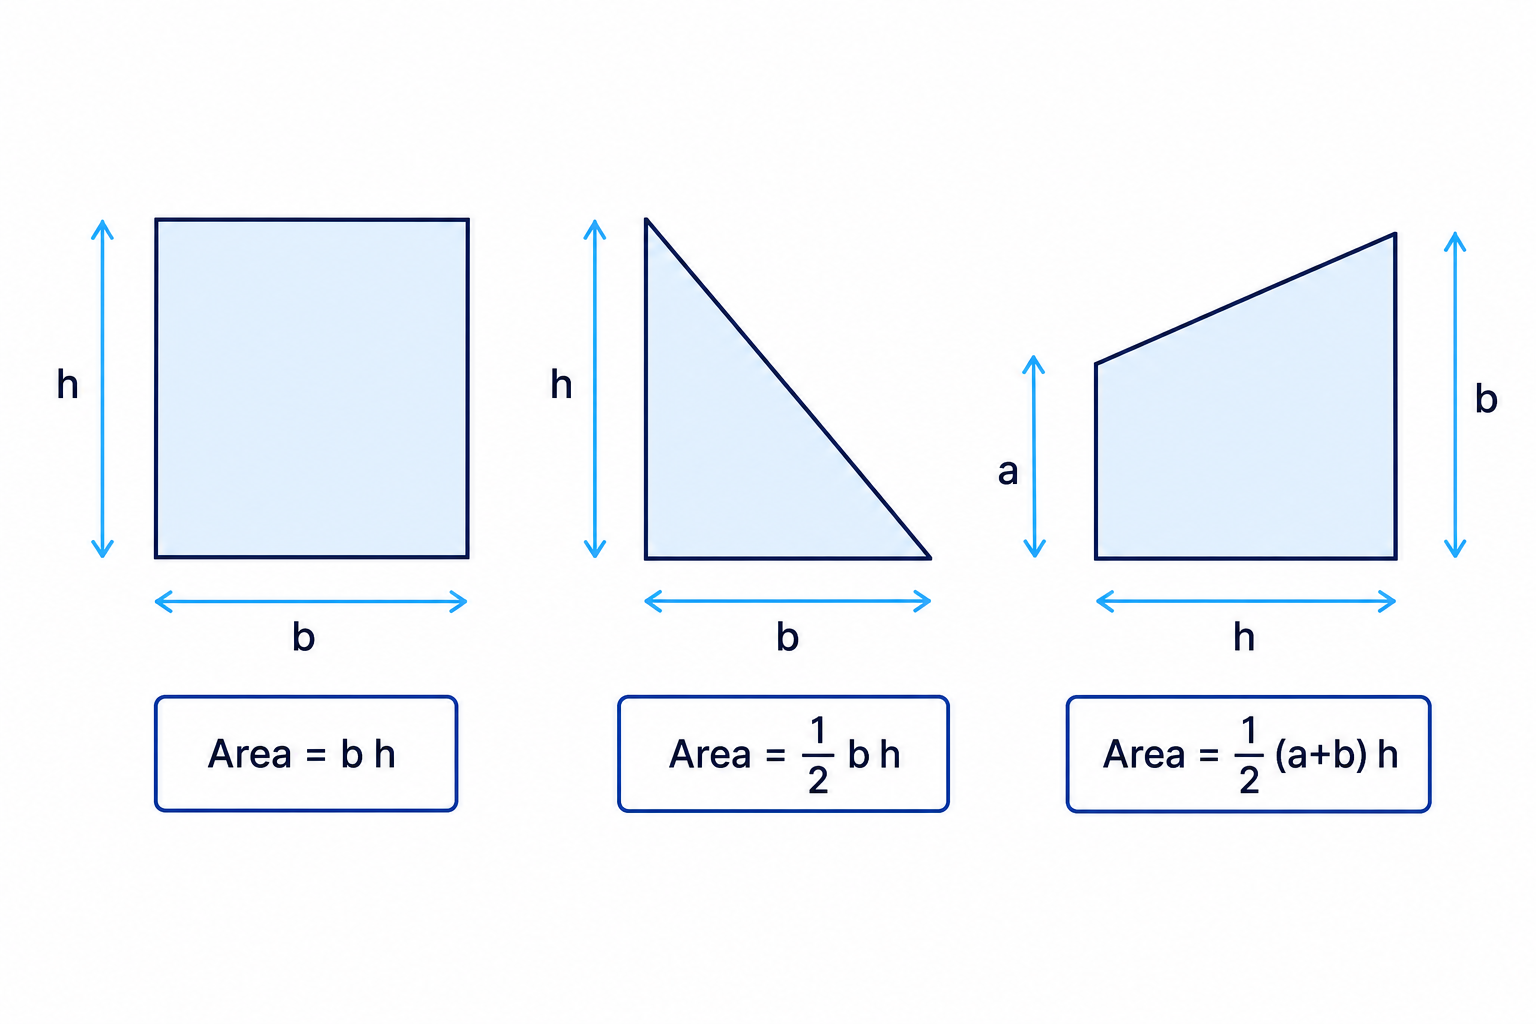
- rectangle: base times height
- triangle: 12×base×height\frac{1}{2} \times \text{base} \times \text{height}21×base×height
- trapezium: 12(a+b)h\frac{1}{2}(a+b)h21(a+b)h, where aaa and bbb are the parallel sides
Example
Finding distance from three sections
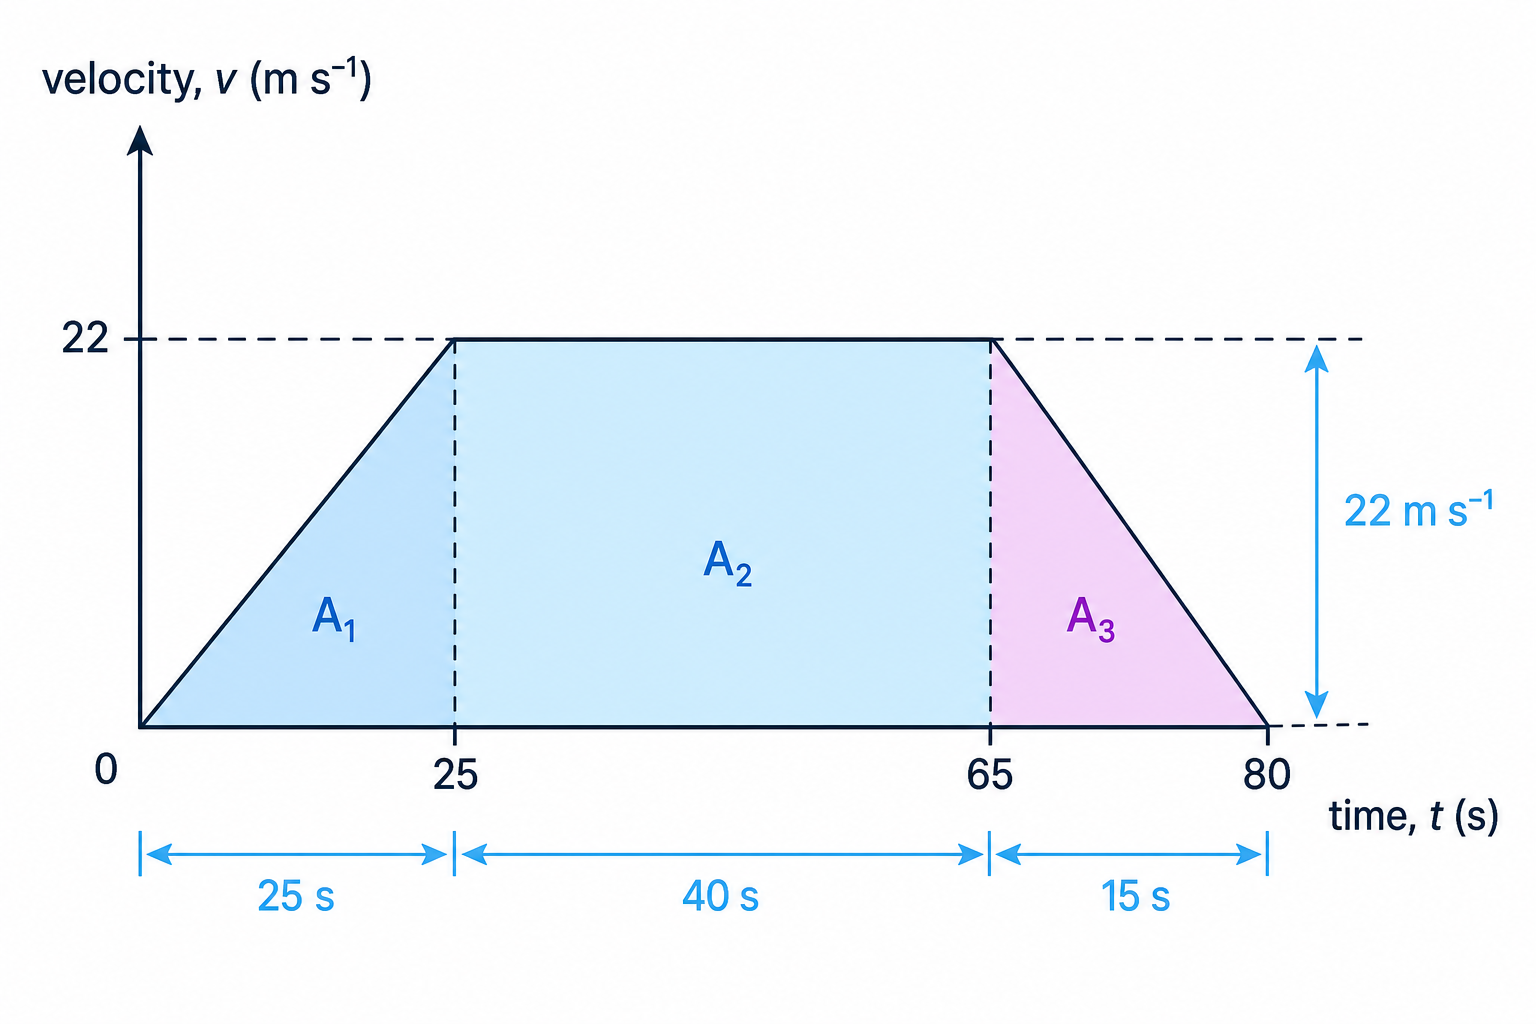
A train starts from rest, reaches 22 m s^-1 in 25 s, travels at this velocity for 40 s, then slows uniformly to rest in 15 s. Find the distance travelled.
-
Split the graph into three areas: a triangle, a rectangle, and another triangle.
-
The first triangle has base 25 and height 22:
A1=12×25×22=275A_1 = \frac{1}{2} \times 25 \times 22 = 275A1=21×25×22=275 -
The rectangle has base 40 and height 22:
A2=40×22=880A_2 = 40 \times 22 = 880A2=40×22=880 -
The final triangle has base 15 and height 22:
A3=12×15×22=165A_3 = \frac{1}{2} \times 15 \times 22 = 165A3=21×15×22=165 -
Add the three areas:
A1+A2+A3=275+880+165=1320A_1 + A_2 + A_3 = 275 + 880 + 165 = 1320A1+A2+A3=275+880+165=1320 -
The train travels 1320 m.
Tip
Quick units check
Area uses time times velocity. Seconds times m s^-1 gives metres, so your distance should be in m.
Common Mistake
If the graph goes below the axis
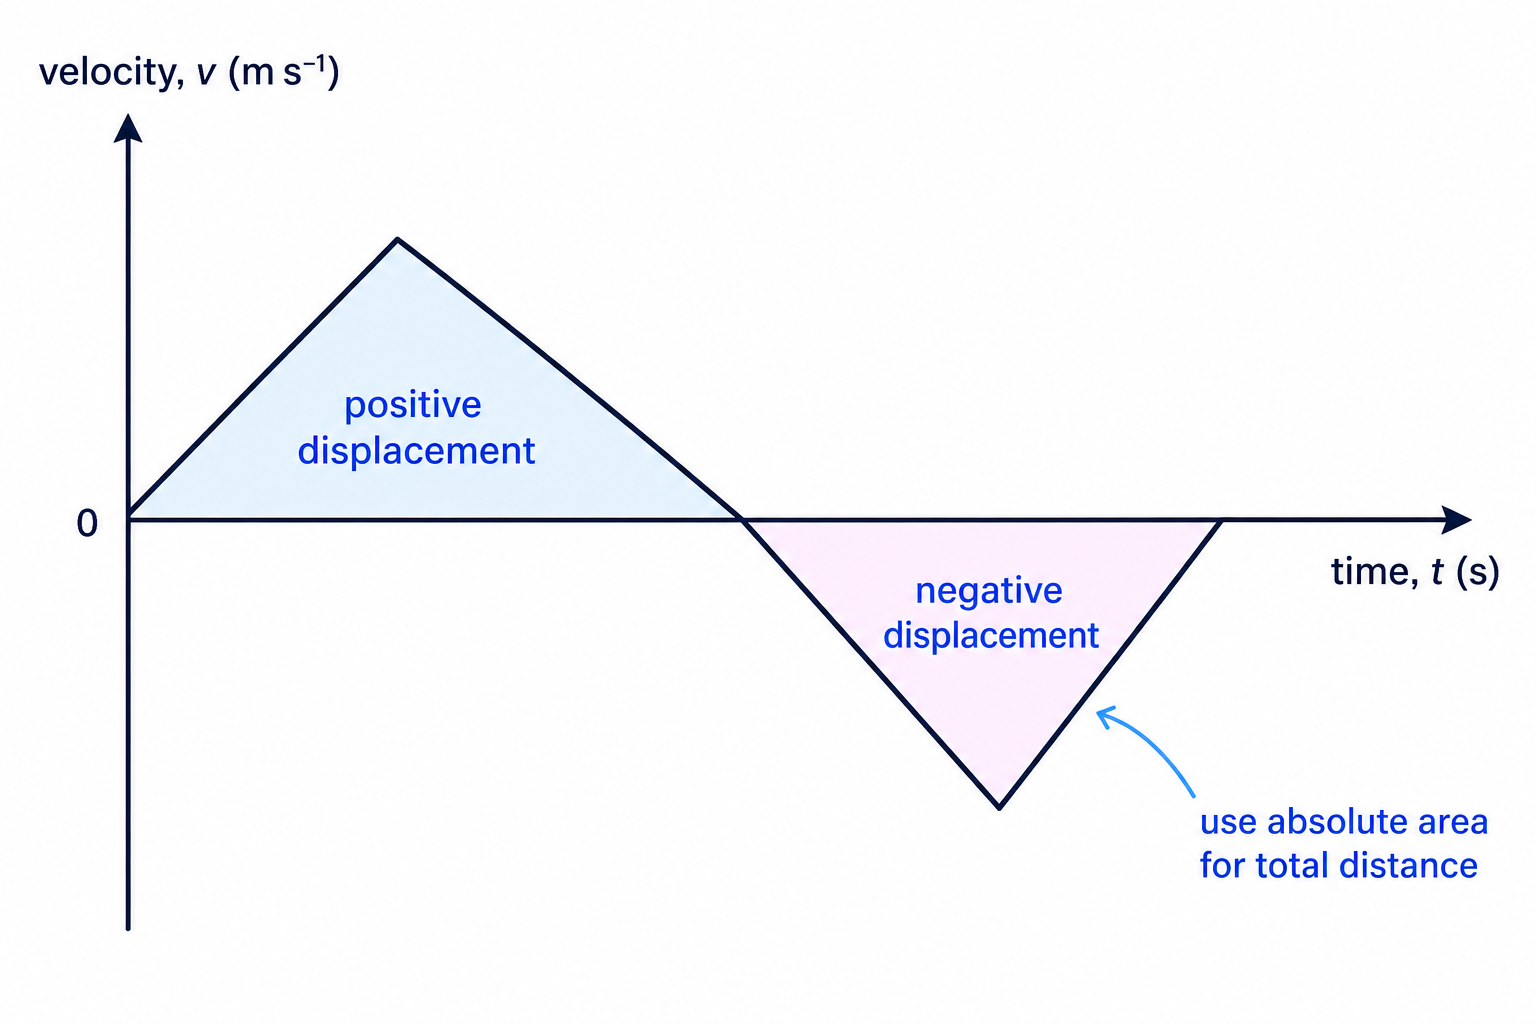
Area below the time axis represents negative displacement. For total distance, add the absolute areas instead of cancelling them.
Sketching accurately enough
A sketch does not usually need perfect scale, but it must show the correct shape and labels. Mark important times, velocities and straight-line sections clearly.
Example
Sketching from a journey description
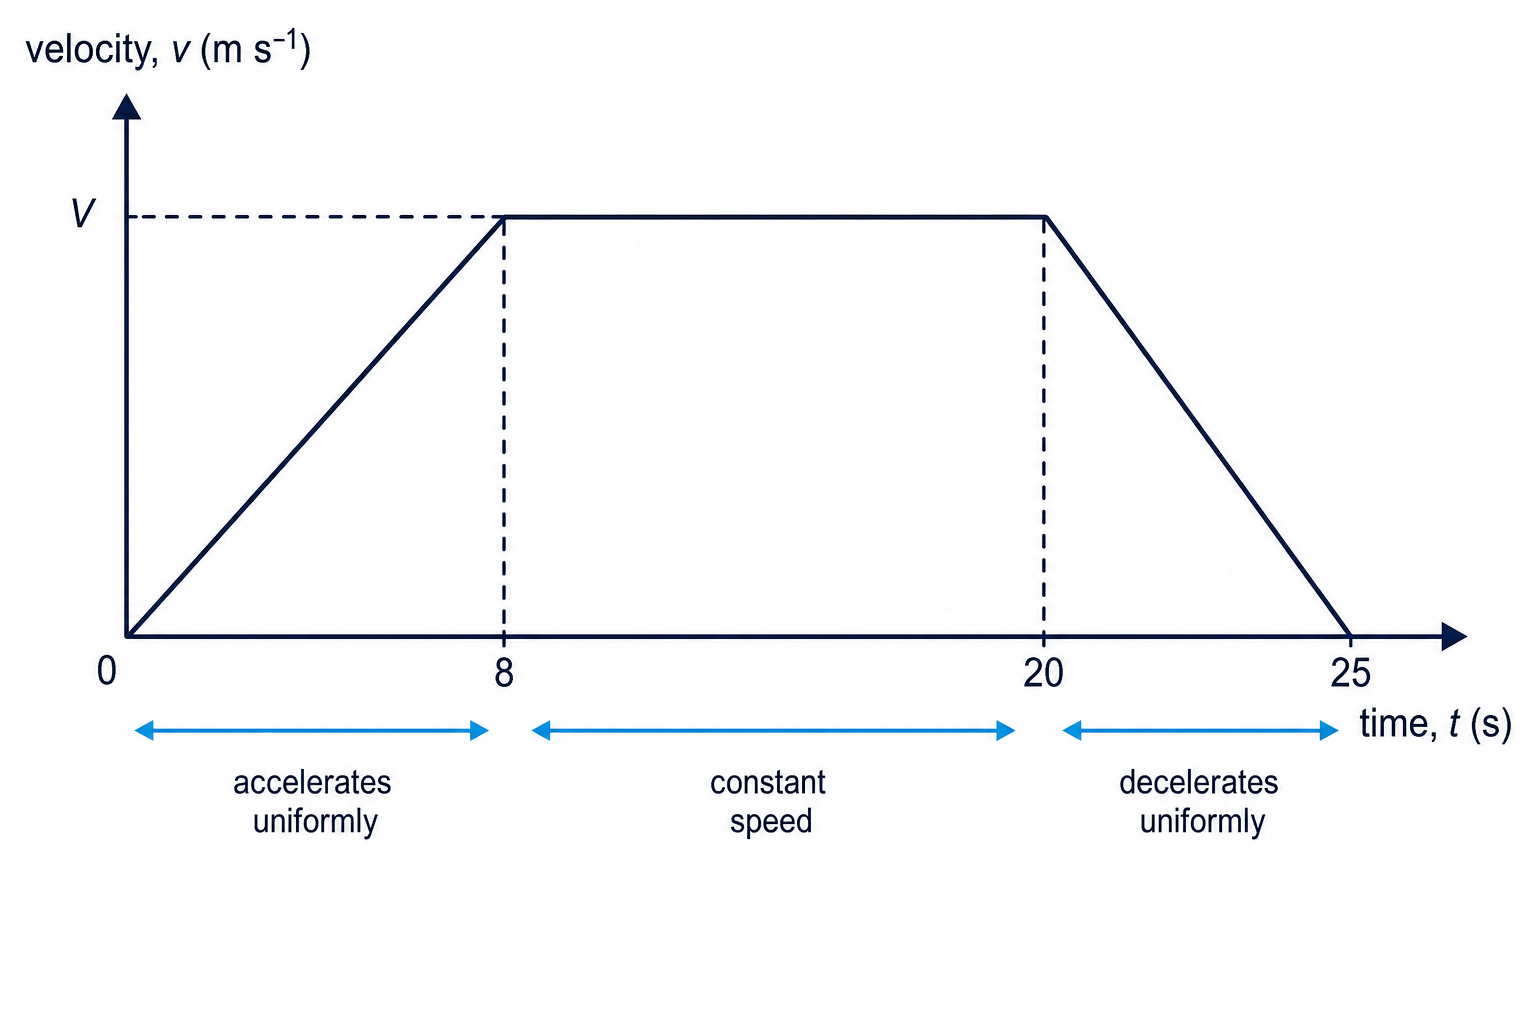
A delivery car starts from rest, accelerates uniformly for 8 s to speed VVV m s^-1, drives at this speed for 12 s, then decelerates uniformly to rest in 5 s. Describe the labelled sketch.
-
Draw time on the horizontal axis and velocity on the vertical axis.
-
Start at the origin because the car starts from rest.
-
Draw a straight rising line from (0,0)(0,0)(0,0) to (8,V)(8,V)(8,V).
-
The constant-speed part lasts 12 s, so draw a horizontal line from time 8 to time 20.
-
Draw a straight falling line from (20,V)(20,V)(20,V) to (25,0)(25,0)(25,0).
-
Label the vertical height VVV and the times 8, 20 and 25 on the time axis.
Combining gradients and areas
Many AS questions give a mixture of acceleration information and total distance. A good order is:
- Use gradients to find missing velocities or times.
- Use areas to form a distance equation.
- Solve the equation, then check the units.
If a vehicle changes speed by the same amount, a larger acceleration magnitude means a shorter time.
time=change in velocitymagnitude of acceleration\text{time} = \frac{\text{change in velocity}}{\text{magnitude of acceleration}}time=magnitude of accelerationchange in velocityExample
Using a related deceleration and an area equation
A car accelerates from rest to VVV m s^-1 in 8 s. It maintains this speed for 36 s, then brakes to rest. The magnitude of the deceleration is twice the magnitude of the acceleration. The total distance is 1008 m. Find the total time and the value of VVV.
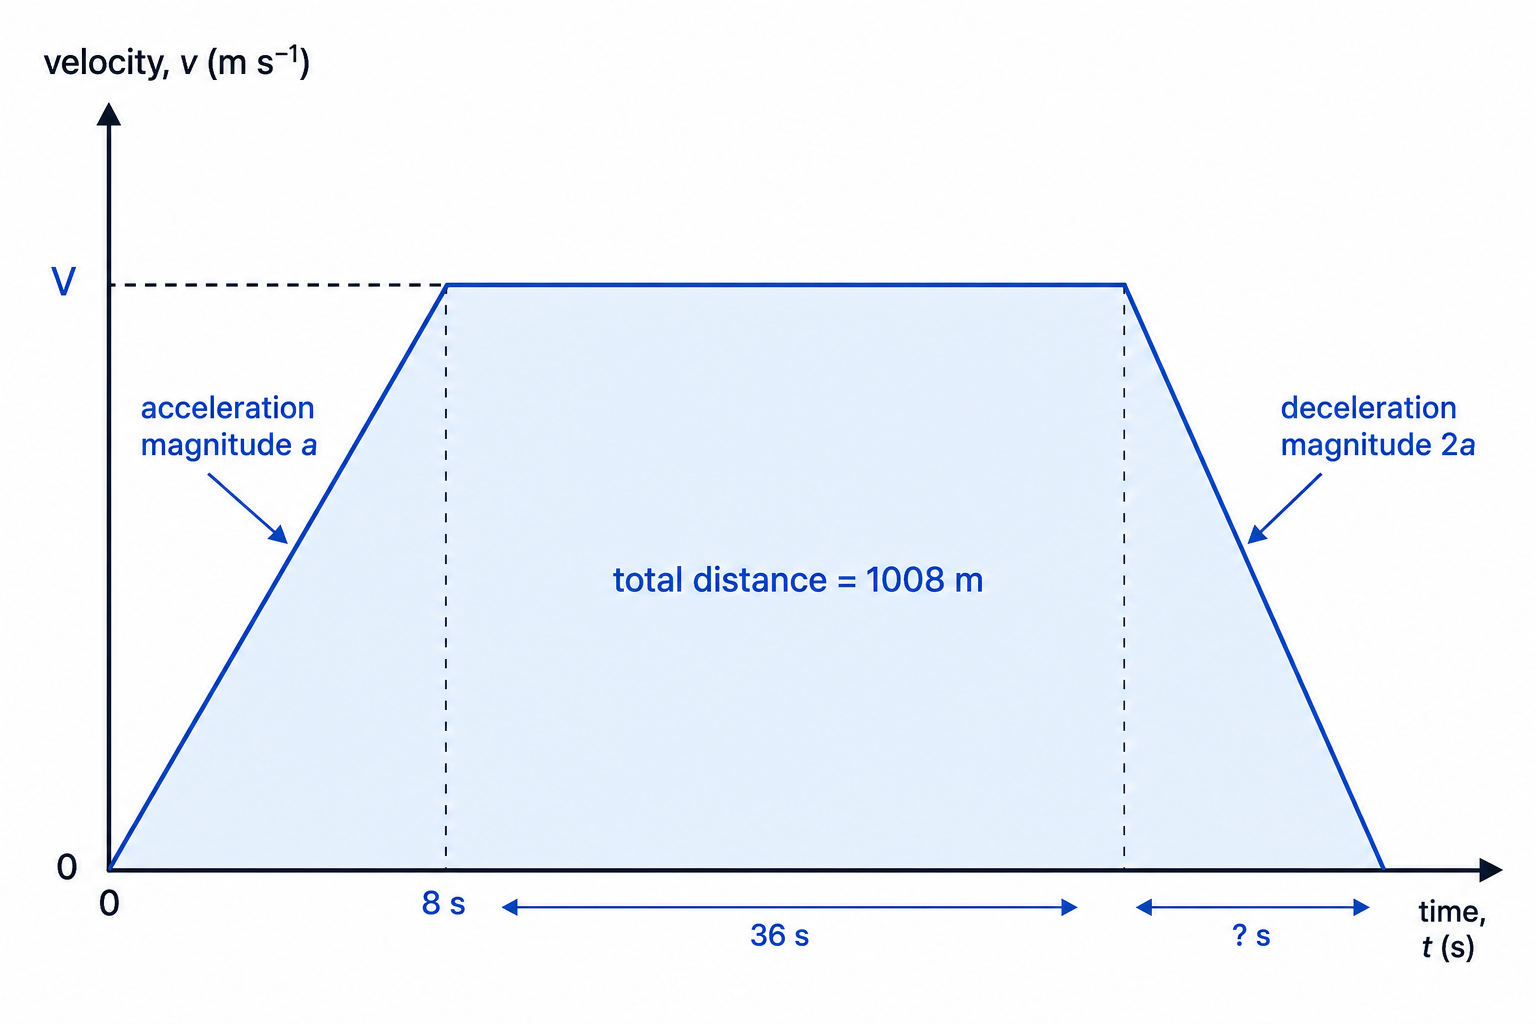
-
The acceleration magnitude while speeding up is:
a=V8a = \frac{V}{8}a=8V -
The deceleration magnitude is twice as large:
2a=2×V8=V42a = 2 \times \frac{V}{8} = \frac{V}{4}2a=2×8V=4V -
Find the braking time using change in velocity divided by deceleration magnitude:
t=VV4=4t = \frac{V}{\frac{V}{4}} = 4t=4VV=4 -
The total time is:
8+36+4=488 + 36 + 4 = 488+36+4=48 -
Now use area under the graph for the distance:
12×8×V+36V+12×4×V=1008\frac{1}{2} \times 8 \times V + 36V + \frac{1}{2} \times 4 \times V = 100821×8×V+36V+21×4×V=1008 -
Simplify the left-hand side:
4V+36V+2V=1008⇒42V=10084V + 36V + 2V = 1008 \Rightarrow 42V = 10084V+36V+2V=1008⇒42V=1008 -
Solve for VVV:
V=24V = 24V=24 -
The maximum speed is 24 m s^-1, and the total time is 48 s.
Example
Using total distance to find cruising time
A train starts from rest, accelerates at 0.5 m s^-2 for 40 s, then travels at constant speed before decelerating at 0.4 m s^-2 to rest. The stations are 3.1 km apart. Find the total time.
-
Convert the distance: 3.1 km is 3100 m.
-
Find the top speed after the acceleration phase:
v=0+0.5×40=20v = 0 + 0.5 \times 40 = 20v=0+0.5×40=20 -
The acceleration section is a triangle with base 40 and height 20:
A1=12×40×20=400A_1 = \frac{1}{2} \times 40 \times 20 = 400A1=21×40×20=400 -
Find the deceleration time:
t=200.4=50t = \frac{20}{0.4} = 50t=0.420=50 -
The deceleration section is another triangle:
A3=12×50×20=500A_3 = \frac{1}{2} \times 50 \times 20 = 500A3=21×50×20=500 -
Find the remaining distance for the constant-speed section:
3100−400−500=22003100 - 400 - 500 = 22003100−400−500=2200 -
Divide by the constant speed to get the cruising time:
tc=220020=110t_c = \frac{2200}{20} = 110tc=202200=110 -
Add all the times:
40+110+50=20040 + 110 + 50 = 20040+110+50=200 -
The total time is 200 s.
Exam technique
In the exam
-
Sketch first: axes, shape, important times, and important velocities.
-
Use gradient for acceleration questions and area for distance questions.
-
Keep units consistent, especially converting km to m before using m s^-1.
-
Check that your answer is sensible: faster speeds should usually reduce time, and larger areas mean longer distances.
Self review
Check yourself
-
What does a horizontal section on a velocity-time graph tell you about acceleration?
-
If velocity rises from 6 m s^-1 to 18 m s^-1 in 4 s, how would you find the acceleration?
-
When a total distance is given, which areas of the graph should you calculate first?

Recap questions
Test yourself with 5 quick questions on this guide. Answer them all correctly to complete it.
You've reached the end
Test yourself on this topic, or move on to the next guide.
How was this guide?