What does the graph in Figure 1 suggest about the relationship between average weekly exercise and self-reported stress score?
Figure 1
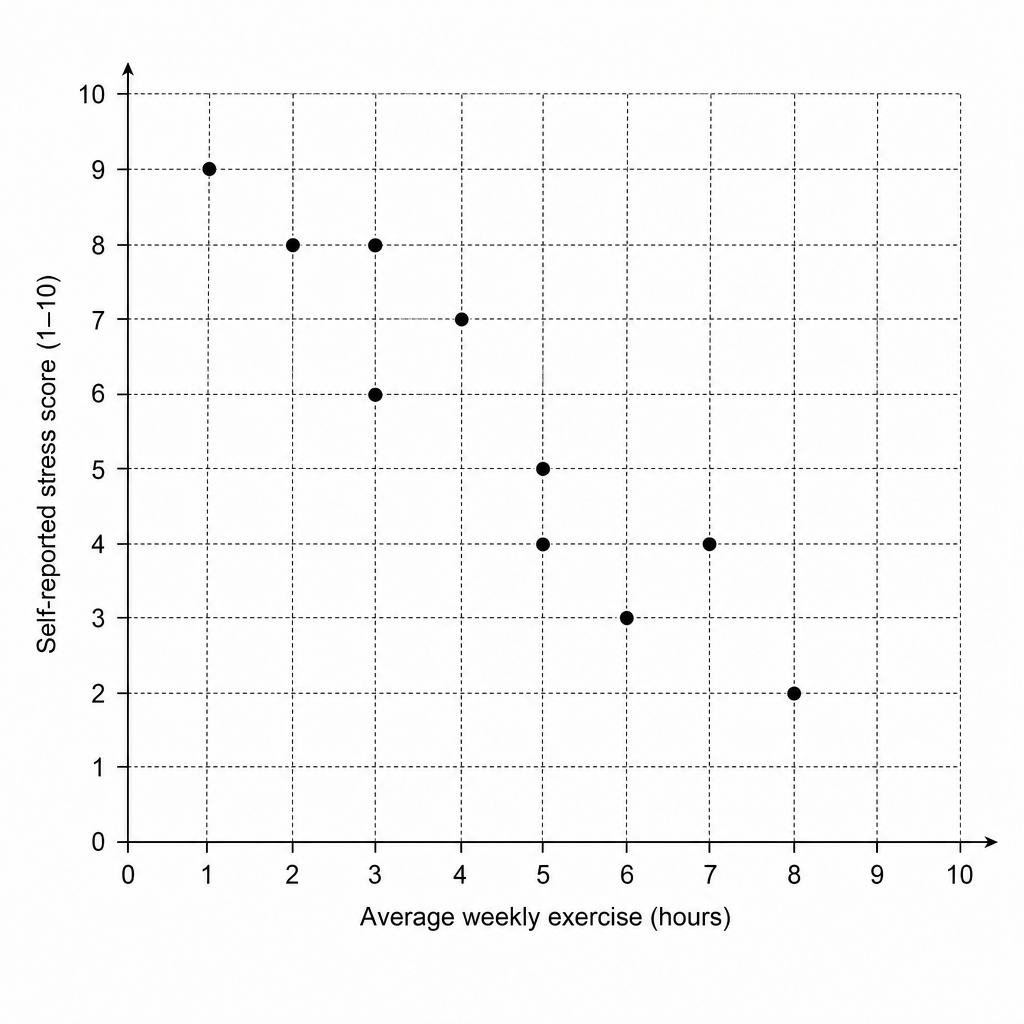
| Average weekly exercise (hours) | Self-reported stress score (1–10) |
|---|---|
| 1 | 9 |
| 2 | 8 |
| 3 | 8 |
| 3 | 6 |
| 4 | 7 |
| 5 | 5 |
| 5 | 4 |
| 6 | 3 |
| 7 | 4 |
| 8 | 2 |
Research methods Questions
Practise AQA A Level Psychology Research methods with exam-style questions for A Level Psychology. 100 questions covering Experimental method, Observational techniques, Self-report techniques, Correlations, Content analysis (A-level only), Case studies (A-level only), Scientific processes, Data handling and analysis, and Inferential testing (A-level only), matched to the AQA A Level Psychology (7182) specification and written in Paper 1, Paper 2 and Paper 3 style. Every question includes a full worked solution and mark scheme, so you can see where marks are awarded rather than just whether you got the answer right.