What you'll learn
- What inferential testing is and why psychologists use it.
- How probability, significance, null hypotheses and critical values fit together.
- How to choose between the Sign test, Mann-Whitney U, Wilcoxon, Chi-square, Spearman’s rho, Pearson’s r and t-tests.
- How to avoid common exam mistakes when interpreting statistical results.
Why inferential testing matters
In psychology, researchers usually study a sample — a smaller group of people selected from a wider population. Descriptive statistics, such as means, medians, ranges and graphs, summarise what happened in that sample.
But A-Level research methods goes further: psychologists want to know whether the pattern in the sample is likely to reflect something real in the population, or whether it could just be due to chance.
Inferential testing
Inferential testing means using a statistical test to judge whether a result from a sample is likely to be due to chance, so that a researcher can make a cautious inference about the wider population.
The basic logic
Inferential tests do not prove that a hypothesis is true. They estimate how likely the observed result would be if there were really no difference or relationship.
Hypotheses: what is being tested?
A hypothesis is a testable statement about a relationship or difference.
The alternative hypothesis says there will be a difference or relationship. This is often written as H1H_1H1.
The null hypothesis says there will be no difference or relationship, and any apparent pattern is due to chance. This is written as H0H_0H0.
For example, if a researcher investigates whether sleep affects memory:
- Alternative hypothesis: people who sleep for 8 hours will recall more words than people who sleep for 4 hours.
- Null hypothesis: there will be no difference in word recall between the 8-hour and 4-hour sleep groups.
Probability and significance
A probability tells us how likely something is to happen. In inferential testing, psychologists usually use the 5 percent significance level.
Significance level
The significance level is the probability threshold used to decide whether a result is unlikely enough under the null hypothesis. In AQA Psychology, the default is usually p<0.05p < 0.05p<0.05.
If a result is significant at p<0.05p < 0.05p<0.05, this means there is less than a 5 percent probability that the result would occur if the null hypothesis were true.
That does not mean there is a 95 percent chance that the alternative hypothesis is true. It means the result is unlikely enough, under the null hypothesis, for the researcher to reject H0H_0H0.
Significant does not mean important
A statistically significant result may be tiny in real life, especially with a very large sample. Significance is about probability; effect size is about how large or meaningful the result is.
Effect size
An effect size describes the size or strength of a difference or relationship, rather than just whether it is statistically significant.
One-tailed and two-tailed tests
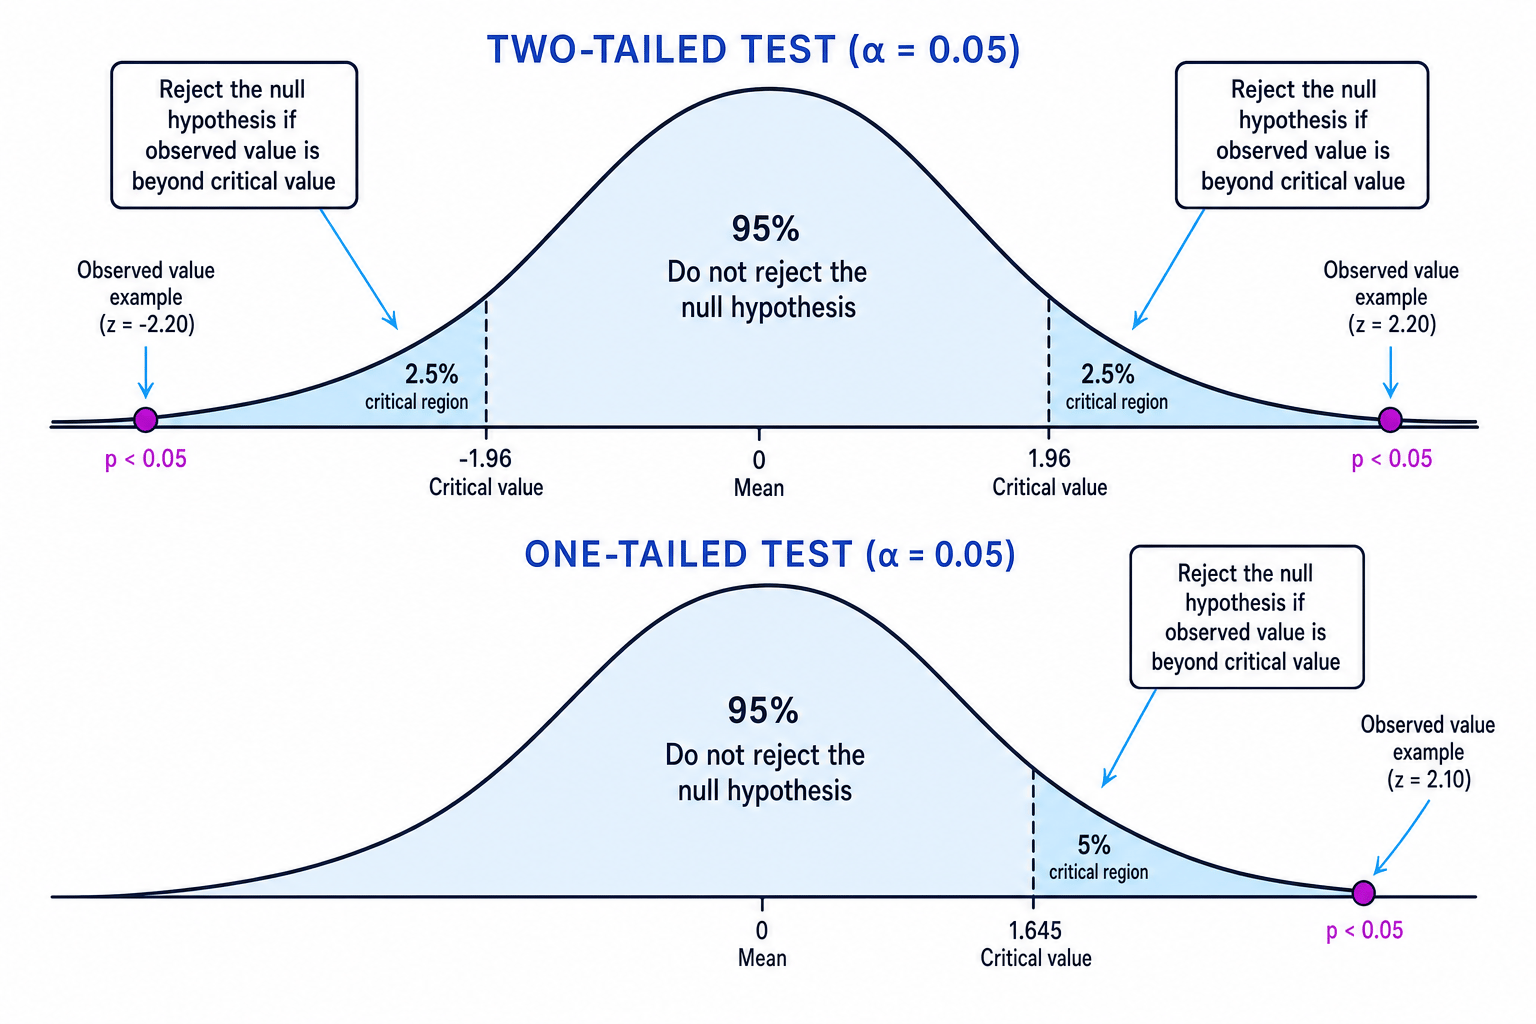
A directional hypothesis predicts the direction of the result. For example: “Participants in the caffeine condition will score higher on alertness than participants in the placebo condition.” This uses a one-tailed test.
A non-directional hypothesis predicts a difference or relationship but not the direction. For example: “There will be a difference in alertness scores between the caffeine and placebo conditions.” This uses a two-tailed test.
The diagram shows the idea of critical regions: areas where the result is unlikely enough for the researcher to reject the null hypothesis.
Choosing the tail after seeing the data
You must decide whether the hypothesis is directional or non-directional before analysing the results. Choosing a one-tailed test after seeing the pattern makes the test unfairly easier to pass.
Type I and Type II errors
Because inferential testing is based on probability, mistakes can happen.
A Type I error is a false positive: the researcher rejects the null hypothesis even though it is actually true. This risk increases if the significance level is too lenient, such as 10 percent.
A Type II error is a false negative: the researcher keeps the null hypothesis even though there really is a difference or relationship. This risk increases if the significance level is too strict, such as 1 percent, or if the sample is too small.
Remember the errors
Type I = you think there is an effect, but there isn’t. Type II = you think there is no effect, but there is.
Choosing the correct inferential test
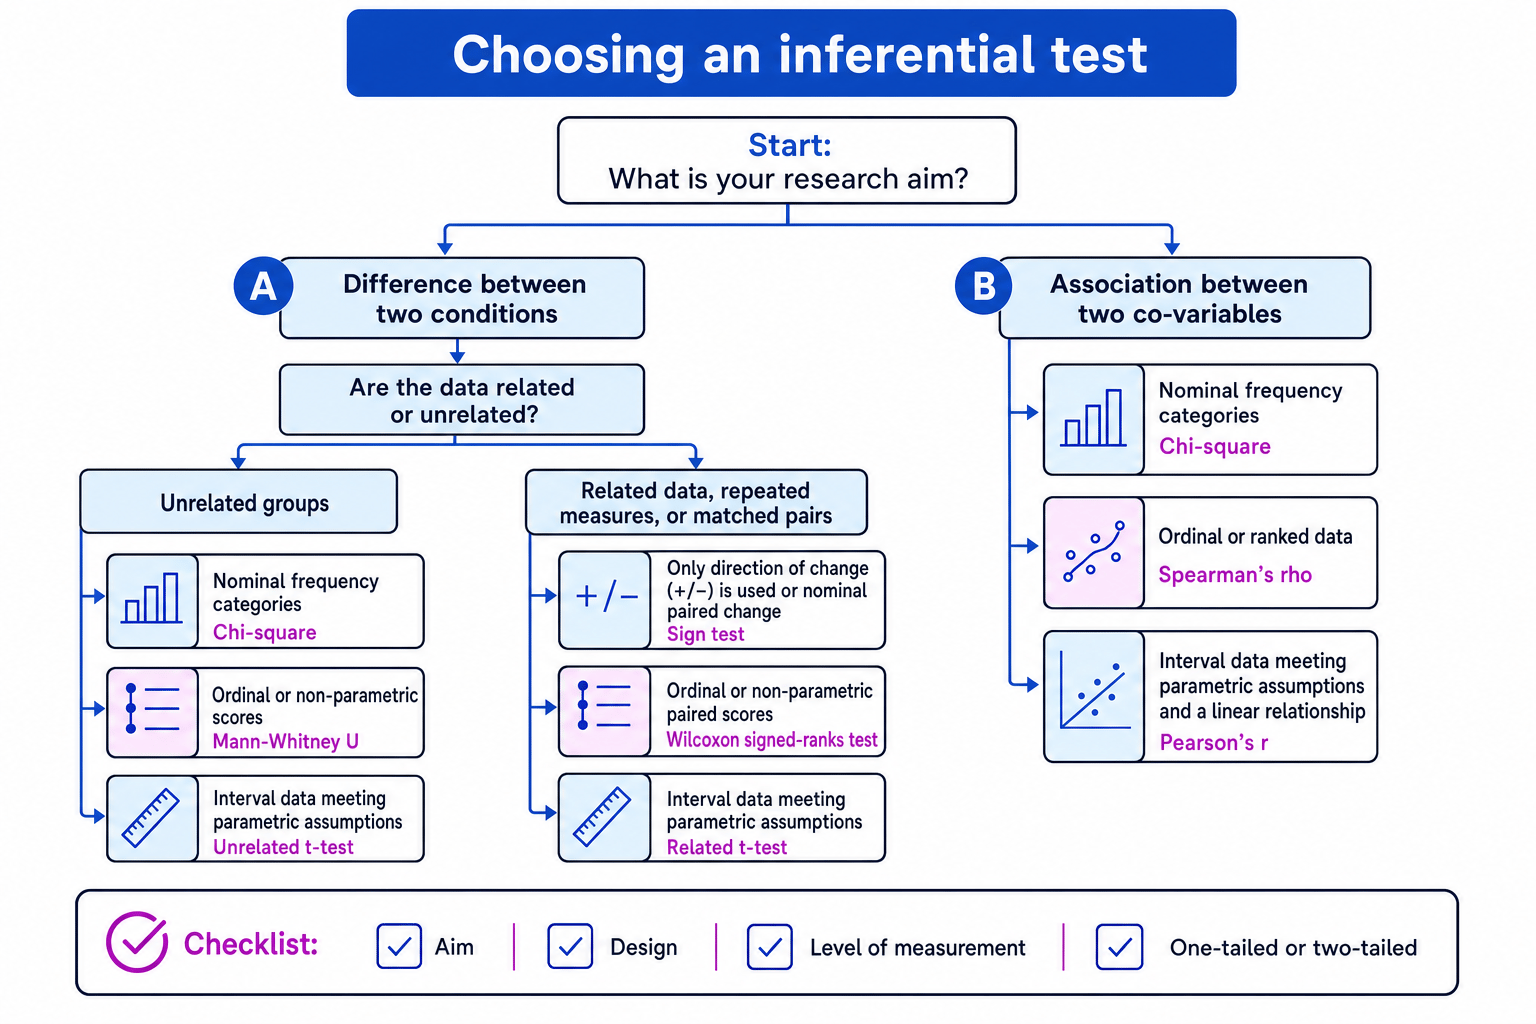
To choose a test, you need three pieces of information.
1. The aim of the study
Is the researcher testing a difference between conditions, or an association between co-variables?
A difference involves comparing groups or conditions, such as therapy A versus therapy B.
An association involves seeing whether two measured variables are related, such as stress score and hours of sleep. In a correlation, the variables are called co-variables, not IV and DV.
2. The experimental design
An independent groups design uses different participants in each condition. The data are unrelated.
A repeated measures design uses the same participants in each condition. The data are related.
A matched pairs design uses different participants, but they are paired on important characteristics. These scores are also treated as related.
3. The level of measurement
Nominal data are categories or frequencies, such as “improved” or “did not improve”.
Ordinal data can be ordered or ranked, but the gaps between scores are not necessarily equal, such as rating scales.
Interval data use equal units, such as many psychological test scores. Ratio data are often treated similarly at A-Level because they also have equal units and a true zero.
Choosing a test
A researcher compares anxiety scores for people who receive CBT with people on a waiting list. The scores come from a ranked anxiety questionnaire and are not normally distributed.
- The aim is to test a difference, because the researcher is comparing two conditions: CBT and waiting list.
- The design is independent groups, because different participants are in each condition, so the scores are unrelated.
- The data are ordinal/non-parametric, because the questionnaire produces ranked scores and the data are not normally distributed.
- The correct test is Mann-Whitney U. At p<0.05p < 0.05p<0.05, the researcher would look up the critical U value for the two group sizes and reject H0H_0H0 if the observed U is equal to or smaller than the critical value.
The main tests you need to recognise
Tests of difference
Use the Sign test for related data when you only use the direction of change, such as better/worse or plus/minus.
Use Wilcoxon signed-ranks for a difference with related data when the data are ordinal or non-parametric.
Use Mann-Whitney U for a difference with unrelated data when the data are ordinal or non-parametric.
Use a related t-test for a difference with related data when the data are interval and meet parametric assumptions.
Use an unrelated t-test for a difference with unrelated data when the data are interval and meet parametric assumptions.
Tests of association
Use Spearman’s rho for a correlation using ordinal/ranked data, or when interval data do not meet parametric assumptions.
Use Pearson’s r for a correlation using interval data, where the relationship is expected to be linear and parametric assumptions are met.
Tests using categories
Use Chi-square for frequency data in categories. It can test whether there is an association between categorical variables, or whether observed frequencies differ from expected frequencies.
Parametric and non-parametric tests
Parametric tests usually require interval data and assumptions such as a roughly normal distribution. Non-parametric tests make fewer assumptions and are often used with nominal, ordinal or non-normal data.
Critical values and decision rules
Most exam questions give you the observed value or calculated value from a statistical test. You then compare it with a critical value from a statistical table.
The critical value depends on things like:
- the significance level, usually p<0.05p < 0.05p<0.05
- whether the test is one-tailed or two-tailed
- the sample size or number of pairs
- sometimes the degrees of freedom, which are based on sample size or number of categories
The decision rule depends on the test:
- For Sign test, Wilcoxon and Mann-Whitney U, the observed value must be equal to or smaller than the critical value.
- For Chi-square, Pearson’s r, Spearman’s rho and t-tests, the observed value usually needs to be equal to or larger than the critical value.
- For correlations, use the strength of the value. A negative correlation can still be significant.
Using the Sign test
A researcher tests whether a revision app improves recall. Ten students complete a memory test before and after using the app. Nine students improve and one student gets worse. There are no ties.
- The design is related, because the same students are tested before and after using the app. The hypothesis is directional because it predicts improvement, so this is a one-tailed test.
- The test uses the direction of change. There are 9 positive signs and 1 negative sign, with no ties, so N=10N = 10N=10.
- For the Sign test, the calculated value SSS is the smaller number of signs. Here, S=1S = 1S=1.
- From the Sign test table for N=10N = 10N=10, one-tailed and p<0.05p < 0.05p<0.05, the critical value is 1.
- The decision rule is S≤critical valueS \le \text{critical value}S≤critical value. Since 1 is equal to 1, the result is significant, so the researcher rejects H0H_0H0 and concludes that the app significantly improved recall.
Evaluating inferential testing
Inferential testing is a major strength of psychological research because it gives researchers a more objective decision rule than simply looking at the means. It helps reduce bias and allows cautious generalisation from a sample to a population.
However, the conclusion is only as good as the research design. A significant result from a biased sample, poorly controlled study or invalid measure may still be misleading.
Inferential tests also do not fix ethical problems. If a study involves deception, lack of consent, harm, poor confidentiality or no debrief, a significant result does not make the research ethically acceptable.
Do not accept the null hypothesis
In psychology, you usually say “reject the null hypothesis” or “fail to reject the null hypothesis”. A non-significant result does not prove there is no effect; it may mean the study lacked power or used an insensitive measure.
In the exam
- Identify the aim first: difference, association, or categorical frequencies.
- Check the design and level of measurement before naming the test.
- State the decision rule clearly: compare observed and critical values, then reject or fail to reject H0H_0H0.
- Do not overclaim: significant means unlikely due to chance at the chosen level, not proven true or practically important.
Check yourself
- Which test would you use for a correlation between two ranked variables?
- Why does a directional hypothesis use a one-tailed test?
- For the Sign test, why are ties ignored?
