What does the graph in Figure 1 suggest about the relationship between daily average wind speed and the number of migratory birds observed?
Figure 1
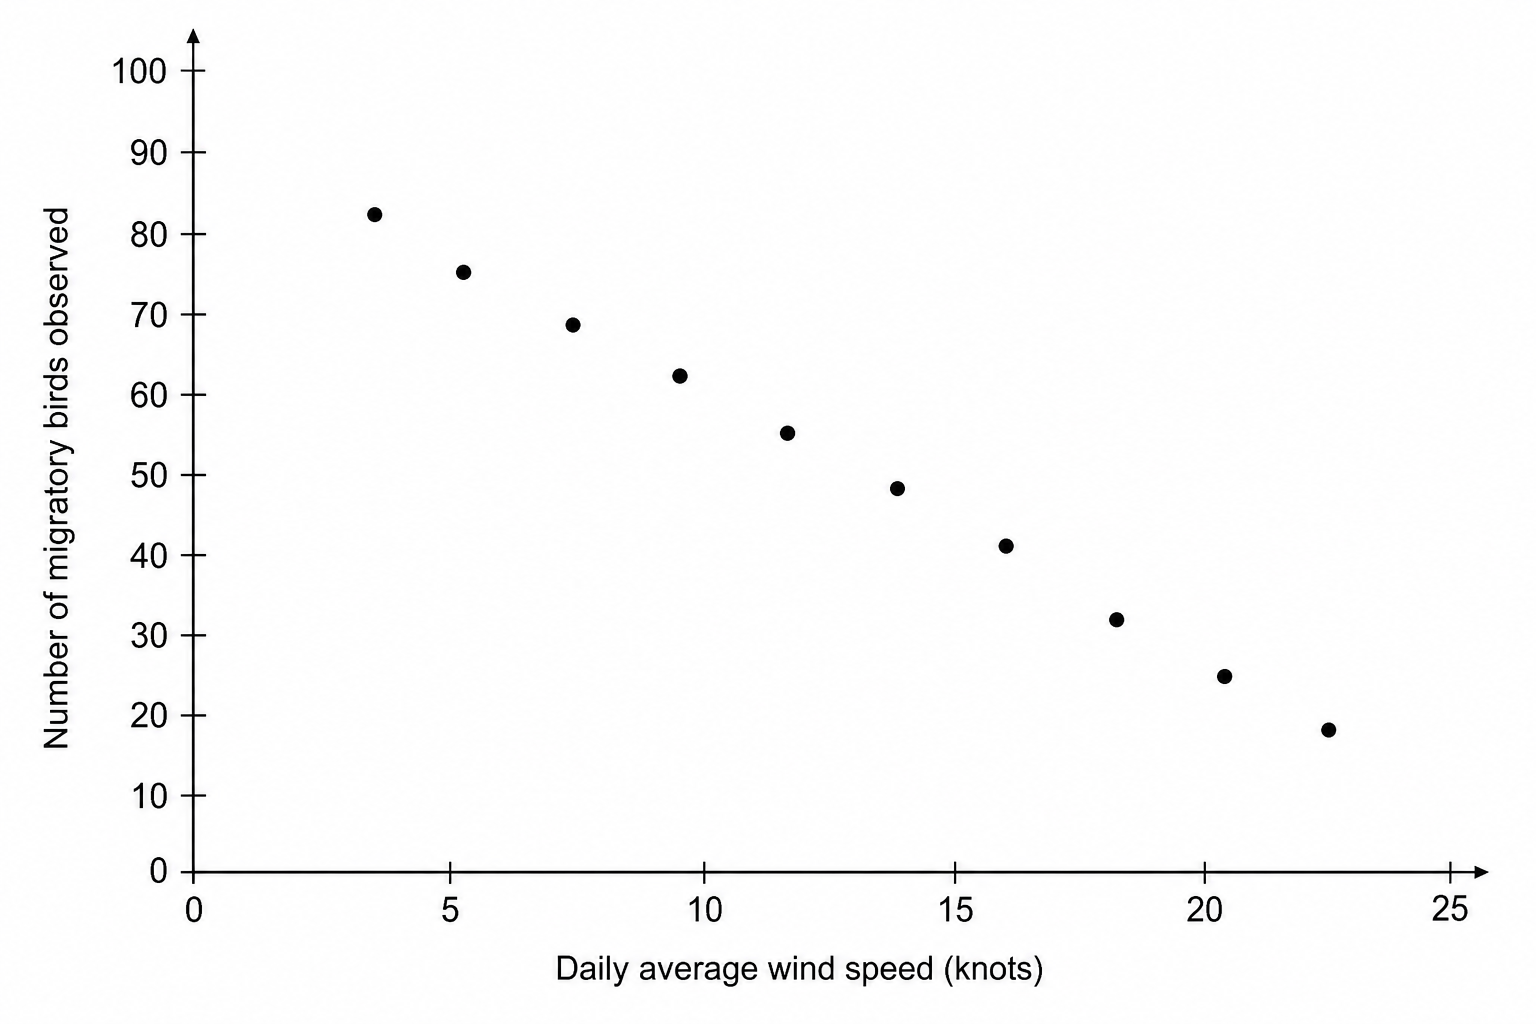
| Daily average wind speed (knots) | Number of migratory birds observed |
|---|---|
| 4 | 82 |
| 6 | 75 |
| 8 | 68 |
| 10 | 62 |
| 12 | 55 |
| 14 | 48 |
| 16 | 41 |
| 18 | 32 |
| 20 | 25 |
| 22 | 18 |
Correlations Questions
Practise AQA A Level Psychology Correlations with exam-style questions for A Level Psychology. 30 questions, matched to the AQA A Level Psychology (7182) specification and written in Paper 1, Paper 2 and Paper 3 style. Every question includes a full worked solution and mark scheme, so you can see where marks are awarded rather than just whether you got the answer right.