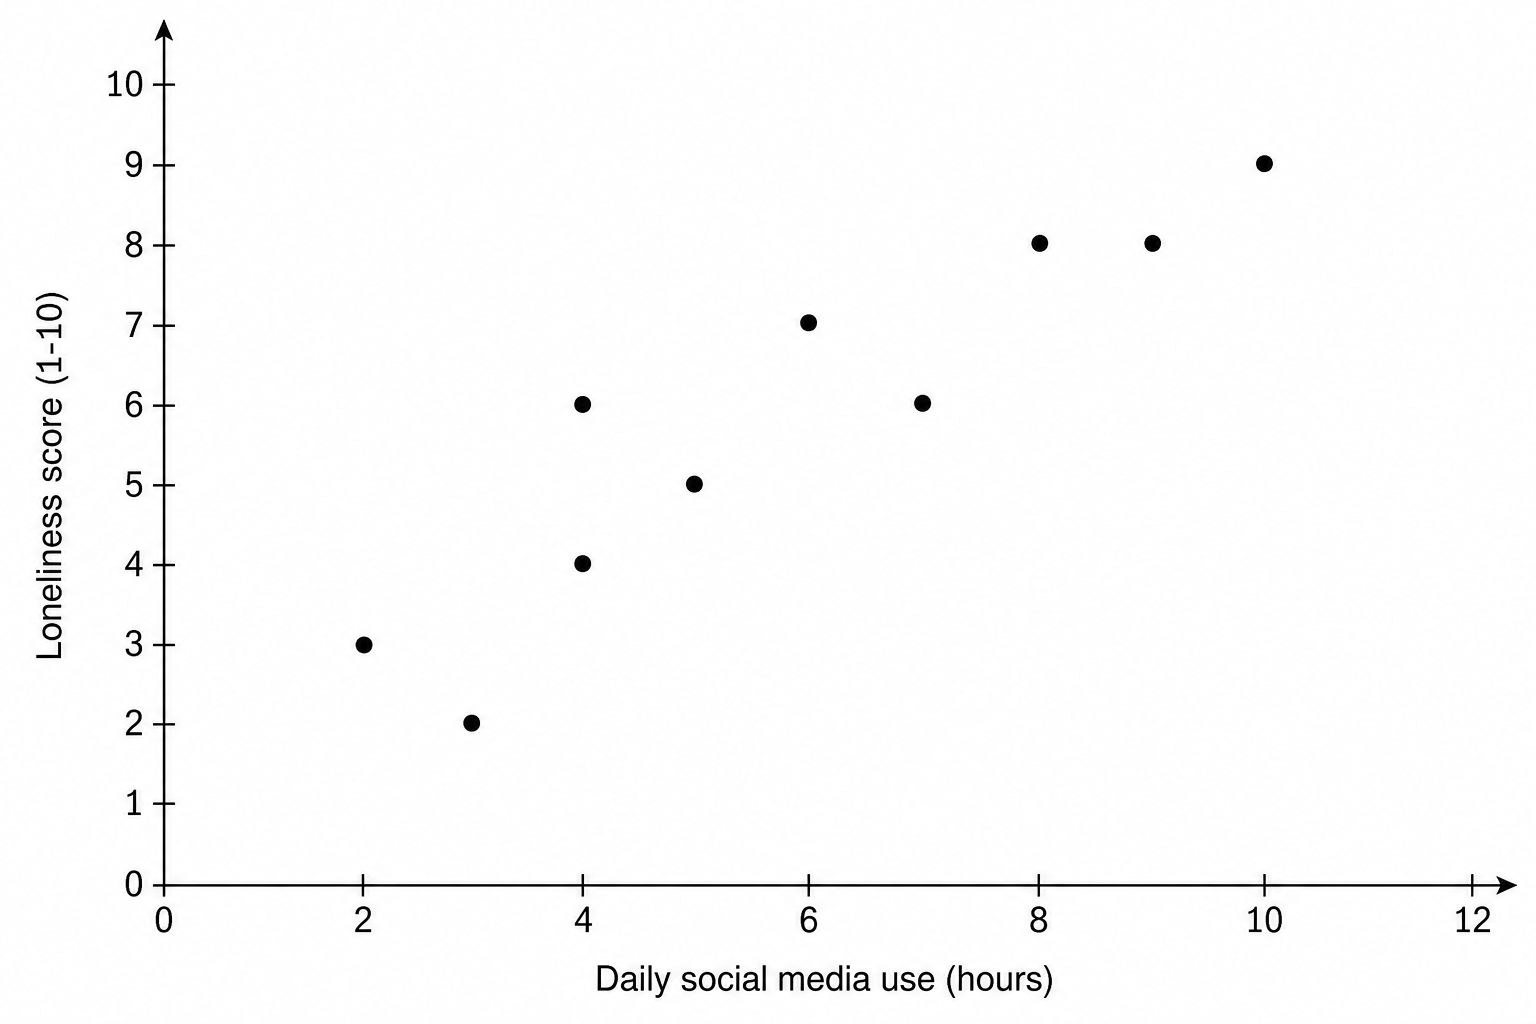
A social researcher investigated the relationship between social media usage and feelings of isolation. They gathered data from a sample of 10 university students and plotted the results.
Figure 1
| Student | Daily social media use (hours) | Loneliness score (1-10) |
|---|---|---|
| A | 2 | 3 |
| B | 3 | 2 |
| C | 4 | 4 |
| D | 4 | 6 |
| E | 5 | 5 |
| F | 6 | 7 |
| G | 7 | 6 |
| H | 8 | 8 |
| I | 9 | 8 |
| J | 10 | 9 |
Explain why the researcher could not conclude that social media usage caused loneliness on the basis of the data in Figure 1.
Correlations Questions
Practise AQA A Level Psychology Correlations with exam-style questions for A Level Psychology. 30 questions, matched to the AQA A Level Psychology (7182) specification and written in Paper 1, Paper 2 and Paper 3 style. Every question includes a full worked solution and mark scheme, so you can see where marks are awarded rather than just whether you got the answer right.