Why spread matters
Why spread matters
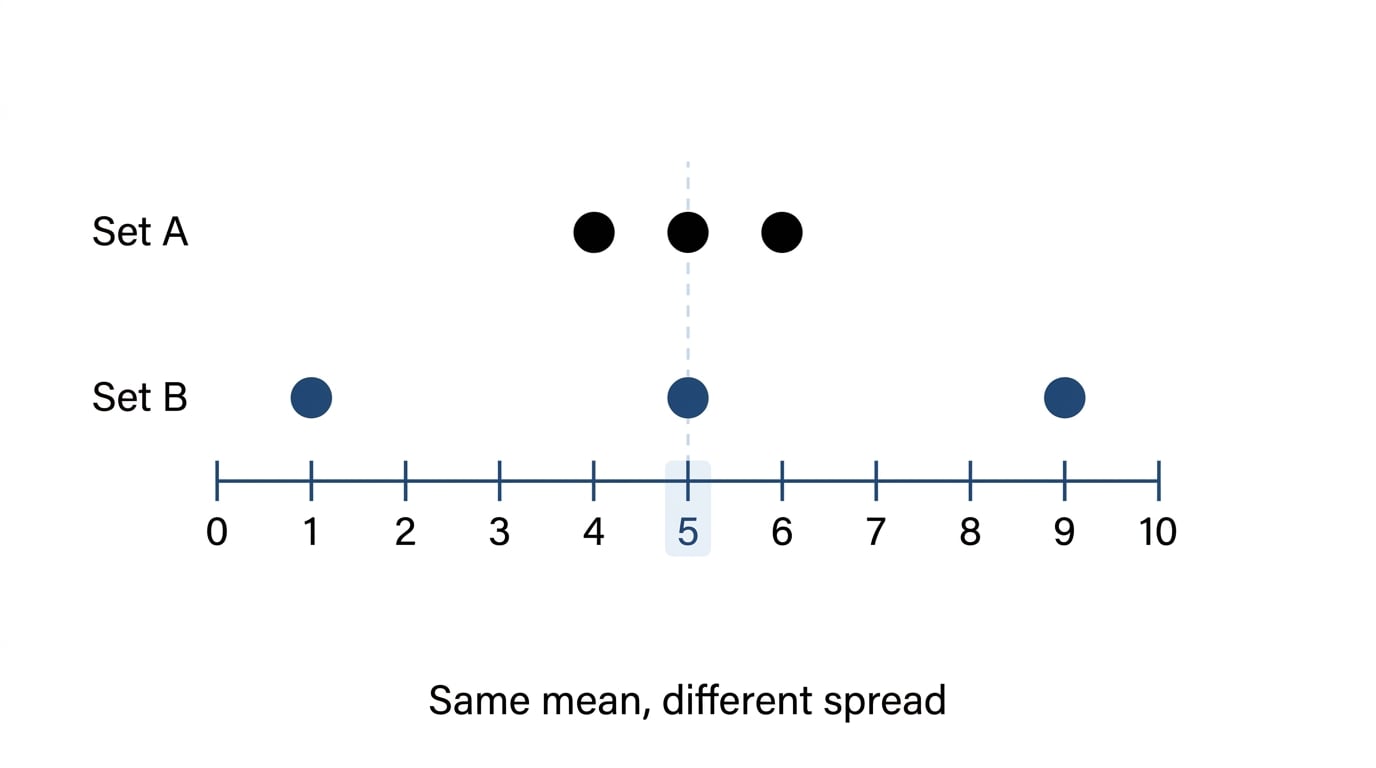
A measure of location, such as the mean, tells you where the data is centred. A measure of spread tells you how tightly the values cluster around that centre.
2.4 Variance and Standard Deviation Lesson
Step-by-step lessons on Edexcel A Level Maths 2.4 Variance and Standard Deviation. Each one builds up to exam-style questions. Build fluency with the core pure algebra and calculus toolkit early, since almost every mechanics and statistics topic on the course depends on it.