Paired data and scatter graphs
Paired data and scatter graphs
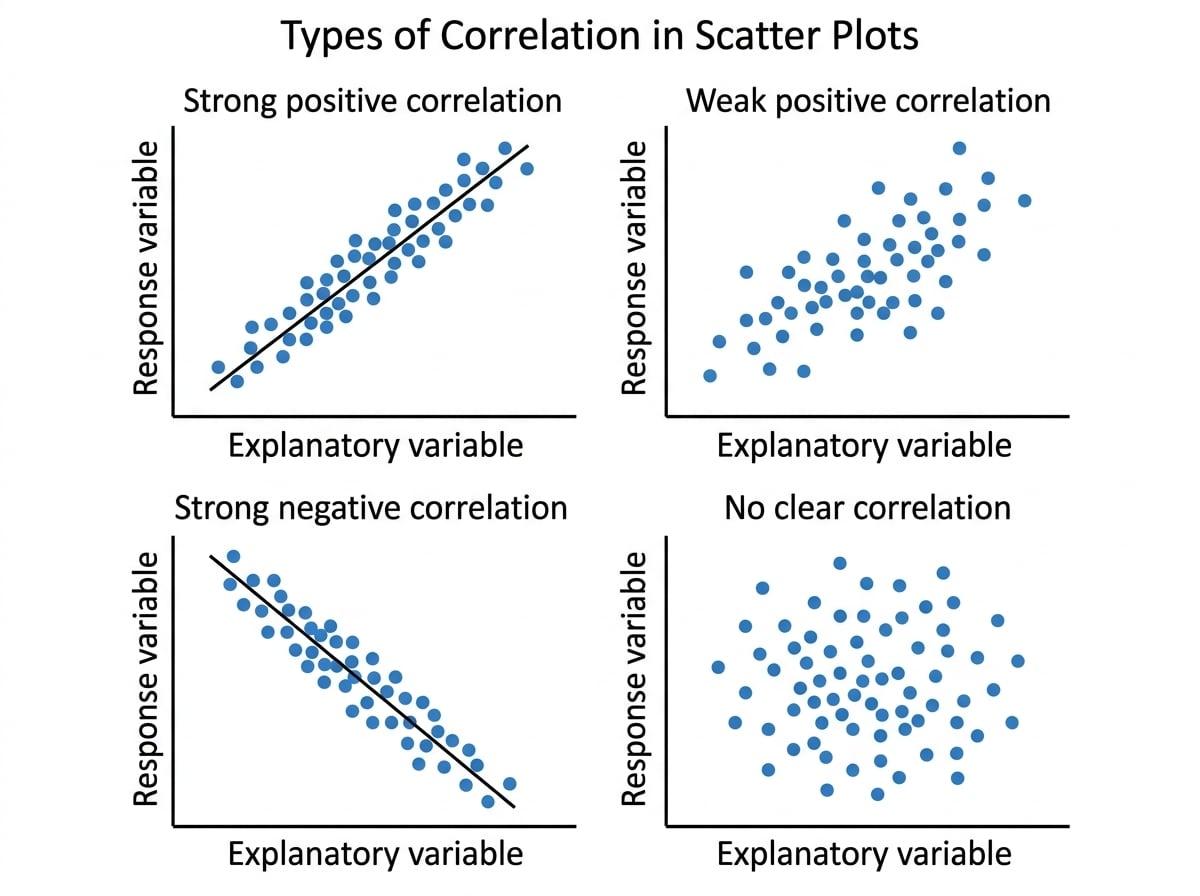
Correlation uses bivariate data, which means two measurements are recorded in pairs for each case. A scatter graph plots each pair as one point so you can look for a relationship.
Correlation Lesson
Step-by-step lessons on Edexcel A Level Maths Correlation, covering 4.1 Correlation and 4.2 Linear Regression. Each one builds up to exam-style questions. Build fluency with the core pure algebra and calculus toolkit early, since almost every mechanics and statistics topic on the course depends on it.