2 Unit AS 2: Applied Mathematics
123456789101112131415161718192021222324252627282930313233343536373839404142434445464748495051525354555657585960616263646566676869707172737475767778798081828384858687888990919293949596979899100101102103104105106107108109110111112113114115116117118119120121122123124125126127128129130131132133134135136137138139140141142143144145146147148149150151152153154155156157158159160161162163164165166167168169170171
Question 136
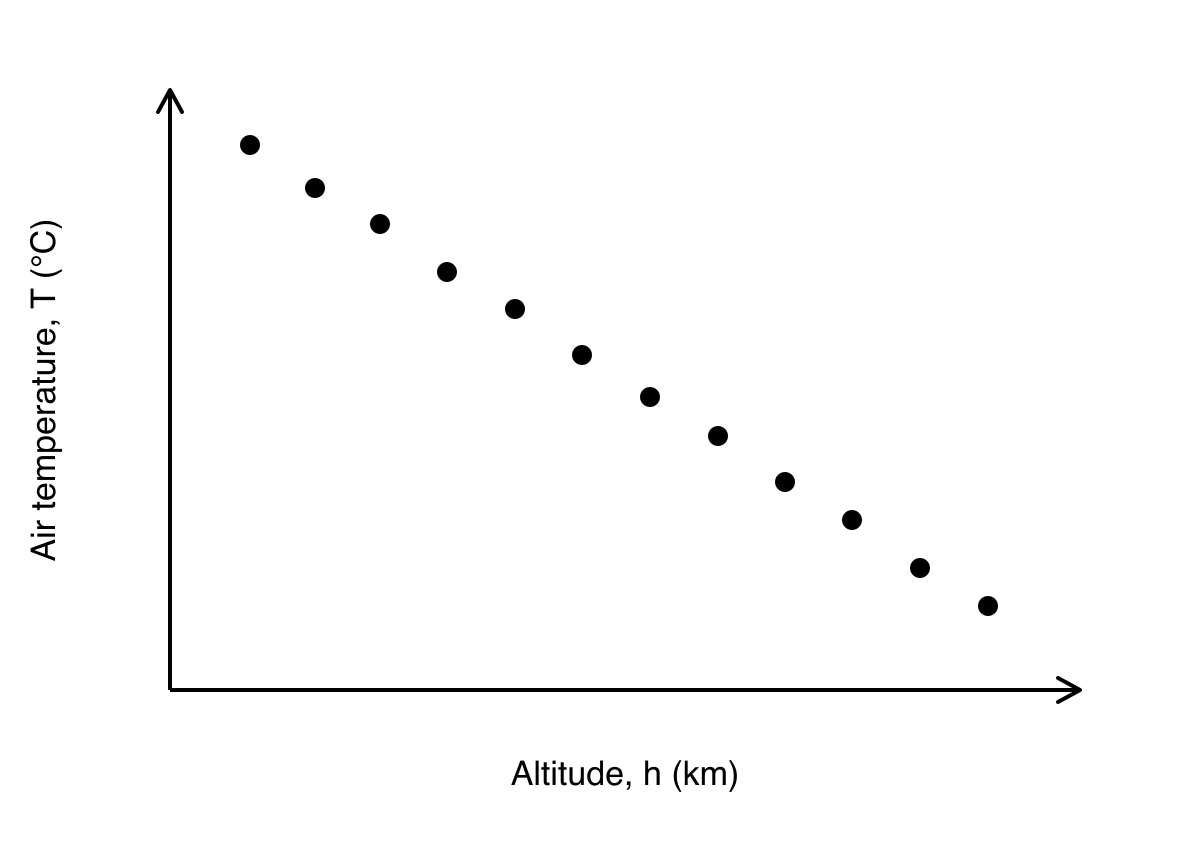
An atmospheric scientist records the relationship between the altitude hhh (in km) and the air temperature TTT (in ∘C{}^\circ\text{C}∘C) above a fixed ground location. The resulting scatter graph shows that as altitude increases, the temperature decreases consistently. The data points are positioned extremely close to a straight line of best fit, with almost no visible deviation from the linear path.
Which of the options below best describes the correlation between hhh and TTT?
-
moderate positive
-
strong positive
-
moderate negative
-
strong negative