2 Unit AS 2: Applied Mathematics
123456789101112131415161718192021222324252627282930313233343536373839404142434445464748495051525354555657585960616263646566676869707172737475767778798081828384858687888990919293949596979899100101102103104105106107108109110111112113114115116117118119120121122123124125126127128129130131132133134135136137138139140141142143144145146147148149150151152153154155156157
Question 52
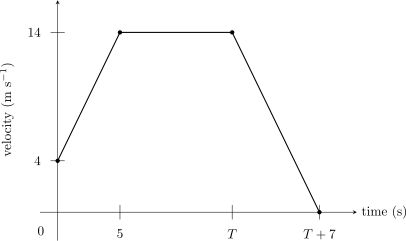
The velocity-time graph of a car consists of straight-line segments joining (0,4)(0,4)(0,4), (5,14)(5,14)(5,14), (T,14)(T,14)(T,14) and (T+7,0)(T+7,0)(T+7,0), where time is measured in seconds and velocity in m s−1^{-1}−1. The total distance travelled is 300 m.
a.[2]
Find the acceleration during the first 5 s.
b.[4]
Find the value of TTT.