Question 45
An ecologist is studying the impact of soil salinity, sss (measured in mS/cm), on the maximum growth height, hhh (measured in cm), of a particular marsh grass. Data collected from 10 different sites are plotted on a scatter diagram. For 9 of these sites, the data points exhibit a strong negative linear correlation. However, the 10th site, labeled 'Site Omega', is located at (48,82)(48, 82)(48,82), which is positioned significantly above the trend line observed in the other 9 sites.
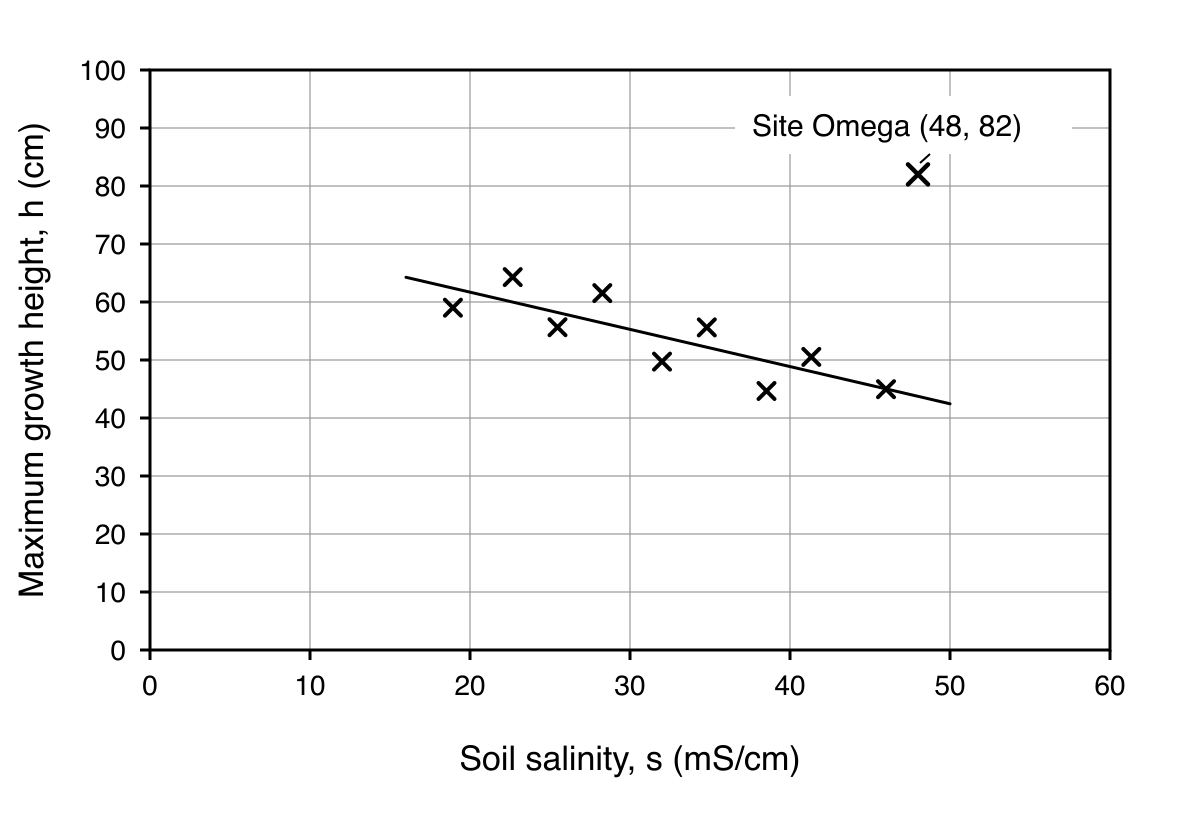
a.[1]
State why Site Omega might be considered an outlier in this context.
b.[2]
For the other 9 sites, the following summary statistics were calculated:
Sss=648.2,Shh=392.5,Ssh=−415.8 S_{ss} = 648.2, \quad S_{hh} = 392.5, \quad S_{sh} = -415.8 Sss=648.2,Shh=392.5,Ssh=−415.8Calculate the product moment correlation coefficient, rrr, for these 9 sites. Give your answer to 3 significant figures.
c.[1]
If Site Omega were included in the calculation of the product moment correlation coefficient for all 10 sites, state what effect this would have on the value of rrr.
2.5 Data presentation and interpretation Questions
278 exam-style questions on CCEA A Level Maths 2.5 Data presentation and interpretation, covering 2.5.1 Data presentation and interpretation, 2.5.2 Data presentation and interpretation, 2.5.3 Data presentation and interpretation, 2.5.4 Data presentation and interpretation, 2.5.5 Data presentation and interpretation, 2.5.6 Data presentation and interpretation, 2.5.7 Data presentation and interpretation, 2.5.8 Data presentation and interpretation, 2.5.9 Data presentation and interpretation, and 2.5 Data presentation and interpretation. Each one has a worked solution and a mark scheme showing where the marks go.