Reading functions from graphs
Reading functions from graphs
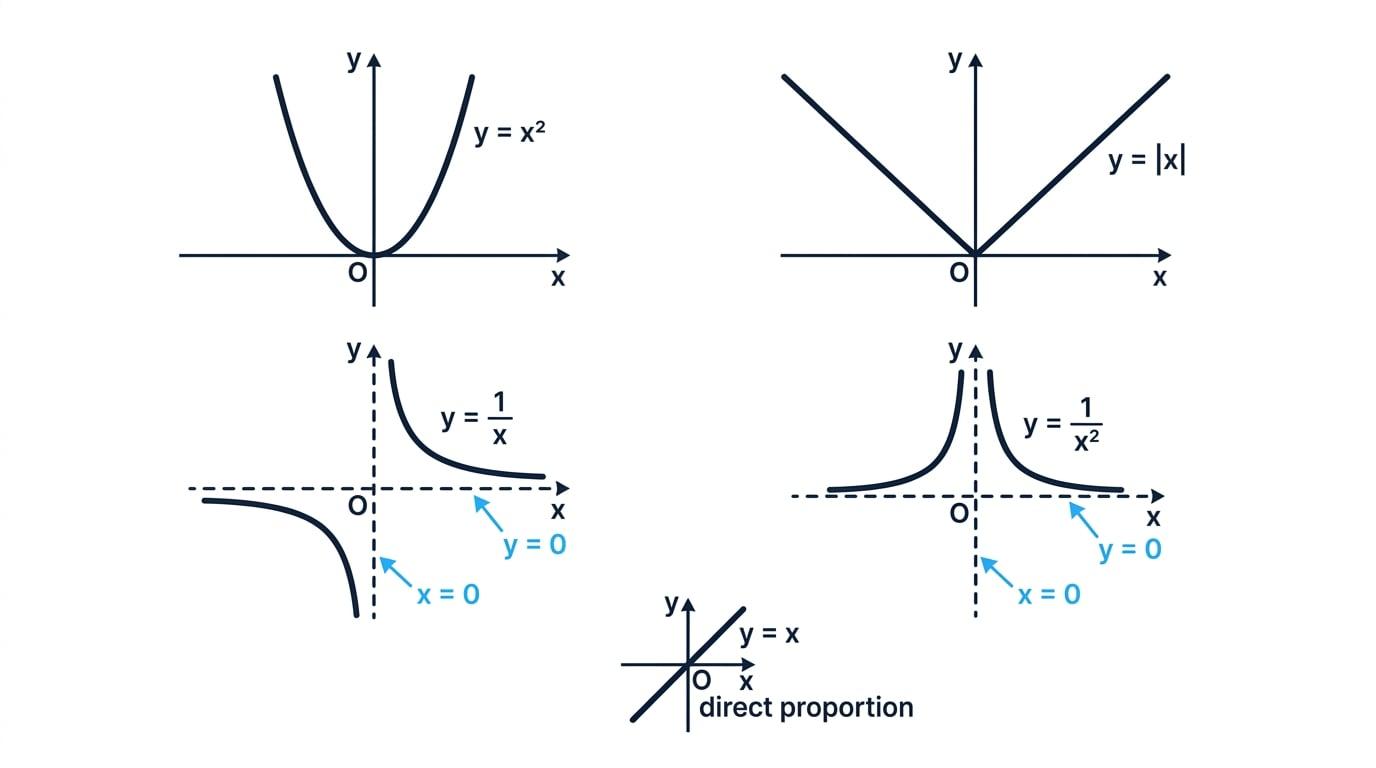
A function assigns exactly one output to each permitted input. The graph of y=f(x)y=f(x)y=f(x) contains every point (x,f(x))(x,f(x))(x,f(x)), so a point (p,q)(p,q)(p,q) lies on the graph precisely when q=f(p)q=f(p)q=f(p).
1.5.7 Graphs of functions and proportion Lesson
Step-by-step lessons on AQA A Level Maths 1.5.7 Graphs of functions and proportion. Each one builds up to exam-style questions. Build fluency with the core pure algebra and calculus toolkit early, since almost every mechanics and statistics topic on the course depends on it.