The diagram below shows the impact of a government-imposed maximum price (PmaxP_{\text{max}}Pmax) in a competitive market.
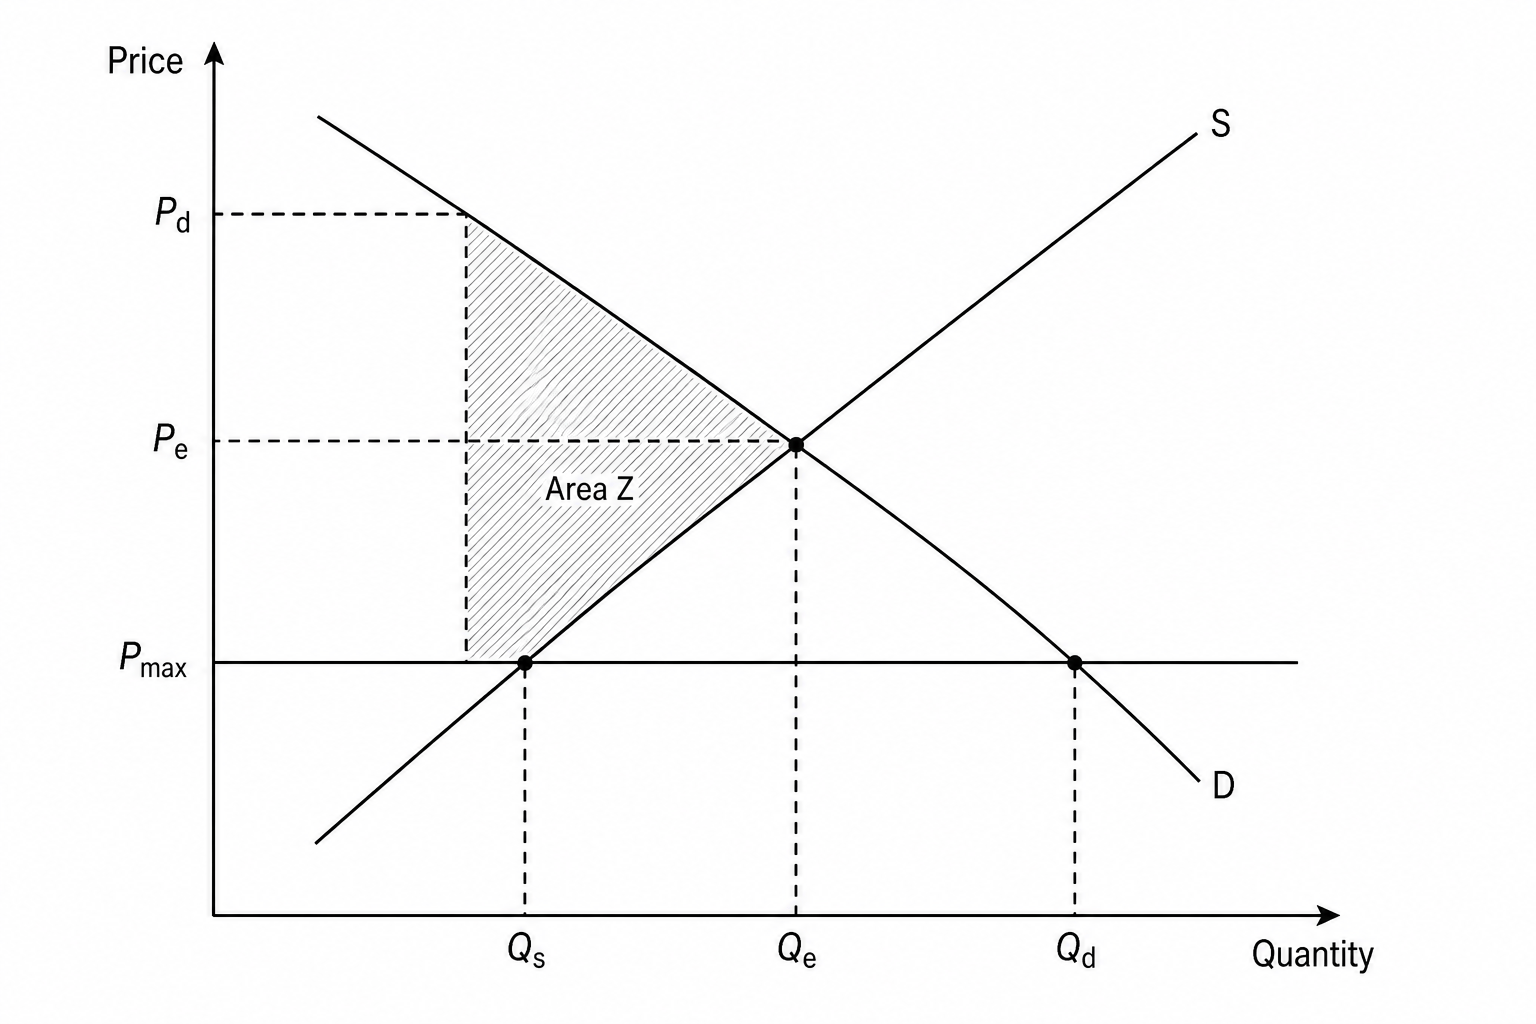
What does the shaded region, Area Z, represent?
The net welfare loss (deadweight loss) to society resulting from the price control
The total consumer surplus after the maximum price is imposed
The market value of the shortage (excess demand) caused by the price control
The transfer of surplus from producers to consumers