Skip to content
MathsGenie logo
Open app

Course home

  1. A Level
  2. Economics OCR
  3. Question bank

Economic policy objectives

EasyMediumHard
1234567891011121314151617181920212223242526272829303132333435363738394041424344454647484950515253545556
Question 13

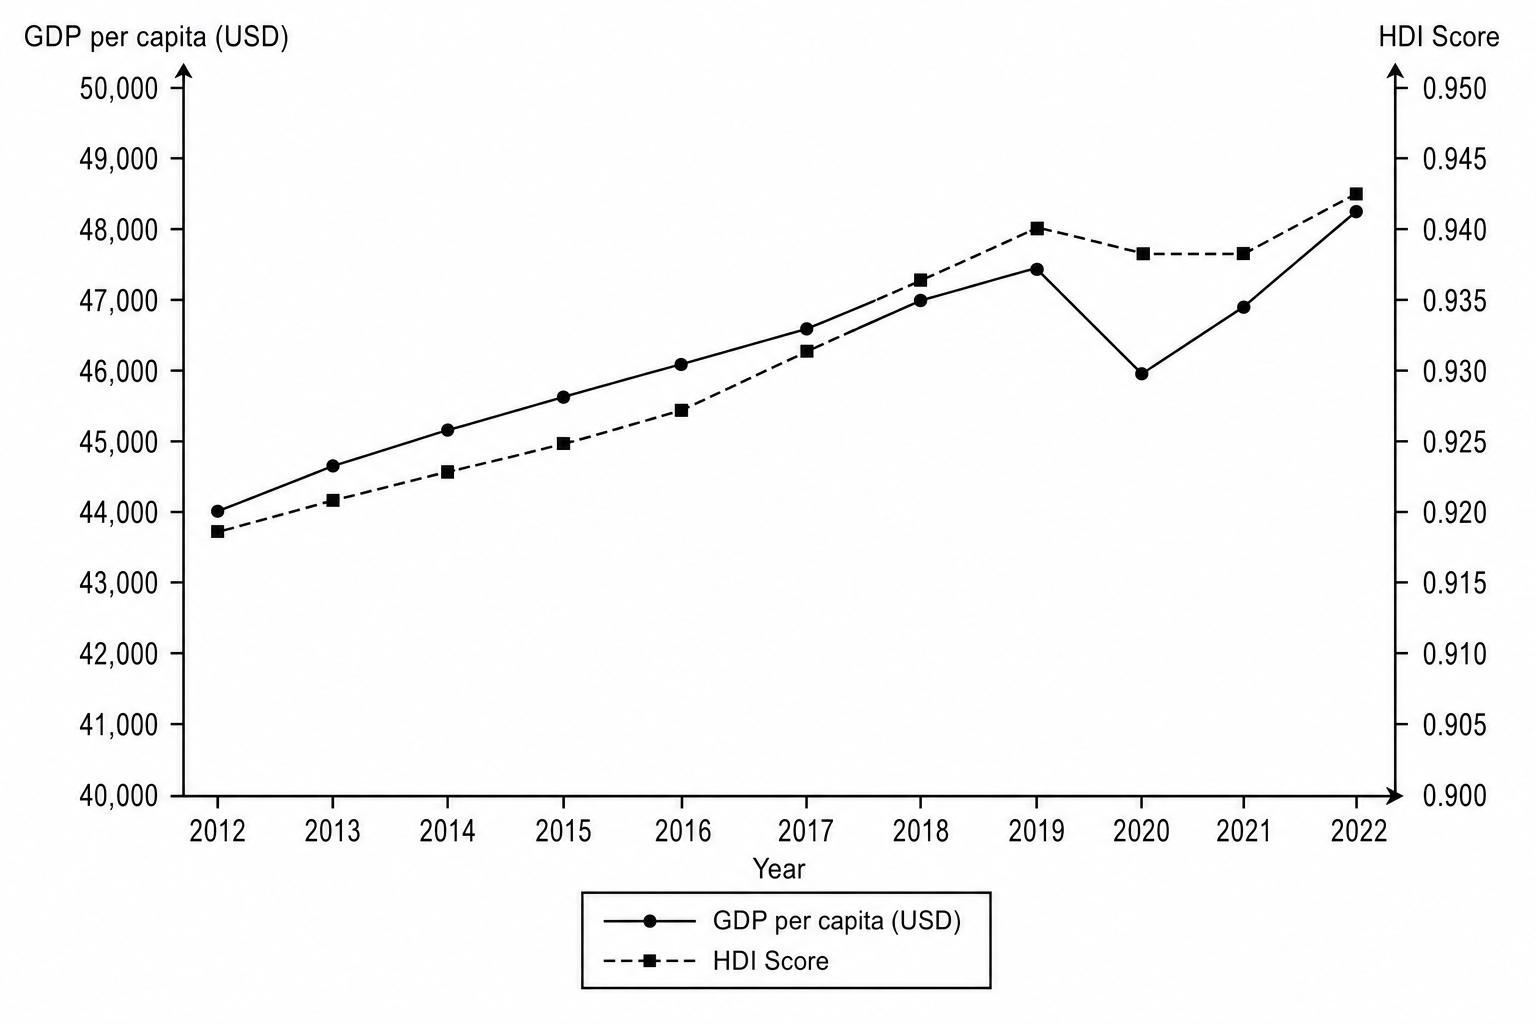
Using Fig. 3.1, compare the trends in Germany's GDP per capita and human development index (HDI) score between 2012 and 2022.

Fig. 3.1: Change in Germany's GDP per capita (USD) and HDI score, 2012–2022

A dual-axis line graph showing two variables from 2012 to 2022. The left y-axis is GDP per capita in USD, ranging from 40,000 to 50,000. The right y-axis is HDI score, ranging from 0.900 to 0.950. The GDP per capita line starts at 44,000 in 2012, rises steadily to 47,500 in 2019, drops sharply to 46,000 in 2020, and then recovers to 48,500 by 2022. The HDI score line starts at 0.920 in 2012, rises steadily and smoothly to 0.940 in 2019, experiences a very minor plateau/dip to 0.938 in 2020-2021, and finishes at 0.942 in 2022.

[2]

Economic policy objectives Questions

  1. A Level
  2. /Economics
  3. /Economic policy objectives