Which pair of diagrams below illustrates short-run economic growth (an increase in actual output)?
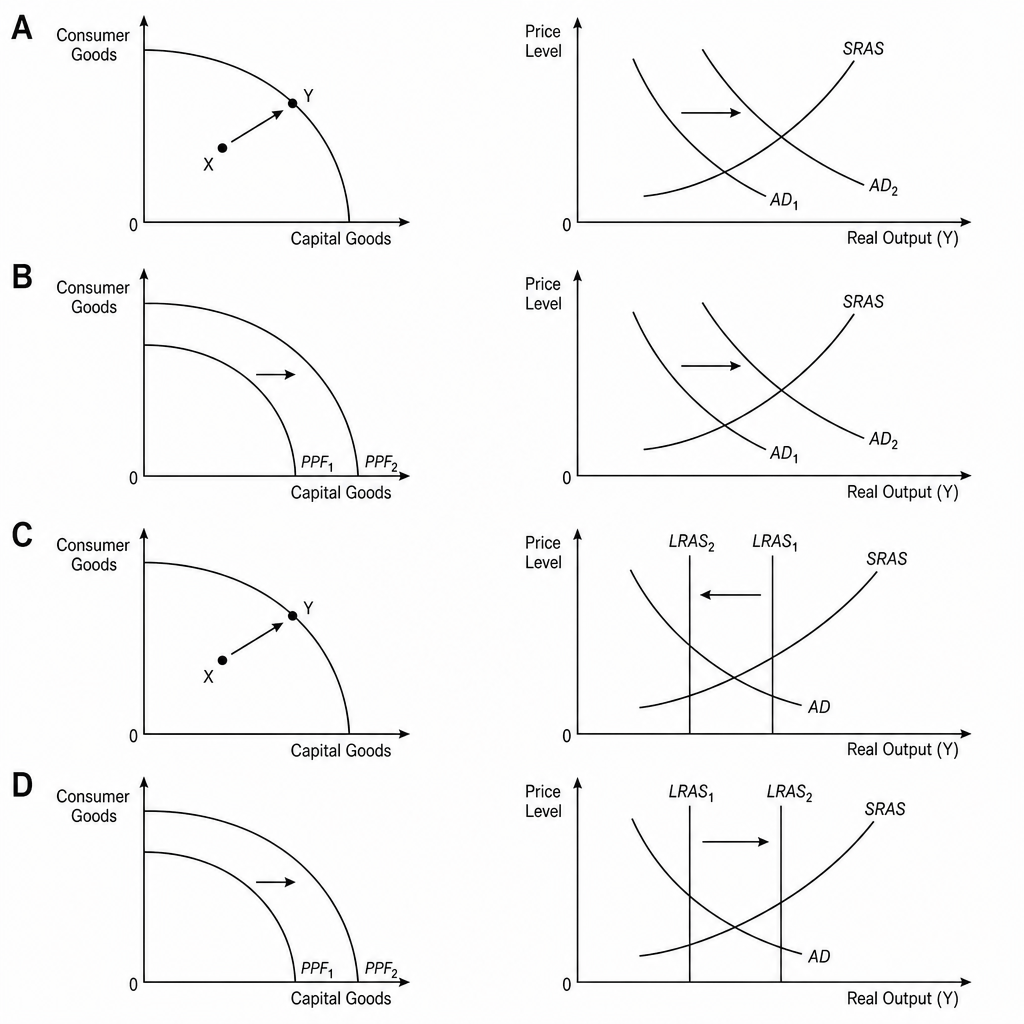
PPF showing movement from a point inside the boundary to a point closer to the boundary, and AD-AS showing AD shifting right
PPF showing outward shift and AD-AS showing AD shifting right
PPF showing movement from a point inside the boundary to a point closer to the boundary, and AD-AS showing LRAS shifting left
PPF showing outward shift and AD-AS showing LRAS shifting right