Components of AD
Aggregate demand (AD): the total planned spending on domestic goods and services at each average price level over a given period.
Consumption (C): planned household spending on goods and services.
Investment (I): planned spending by firms on capital goods such as machinery, buildings and technology.
Government expenditure (G): planned state spending on public goods and services, such as the NHS and education, excluding transfer payments.
Net trade (X − M): the value of exports minus the value of imports.
- Each component is spending by a different economic agent, households for C, firms for I, the state for G and overseas buyers net of UK imports for net trade, so a change in any one alters total demand for UK output.
- AD measures spending that is planned rather than realised, which is why it can be drawn against the price level before the economy settles at its equilibrium output.
Relative importance
- Consumption is the largest component at roughly 60% of UK AD, so consumer confidence is the single biggest influence on total demand: when the cost-of-living squeeze from 2022 dented confidence, households delayed big purchases such as cars and furniture, and even a small % change in C moves AD more than a large change elsewhere.
- Government expenditure is next at around 25% of AD, reflecting large budgets for the NHS, education and welfare provision.
- Investment is smaller at around 15% to 20% of AD, but it is the most volatile component because it swings with business confidence and expected returns.
- Net trade is small and usually negative because the UK typically imports more than it exports, so it tends to subtract from AD rather than add to it, though a weaker pound after 2016 made UK exporters such as Jaguar Land Rover and Scotch whisky distillers more price-competitive abroad and lifted their export earnings.
The AD curve
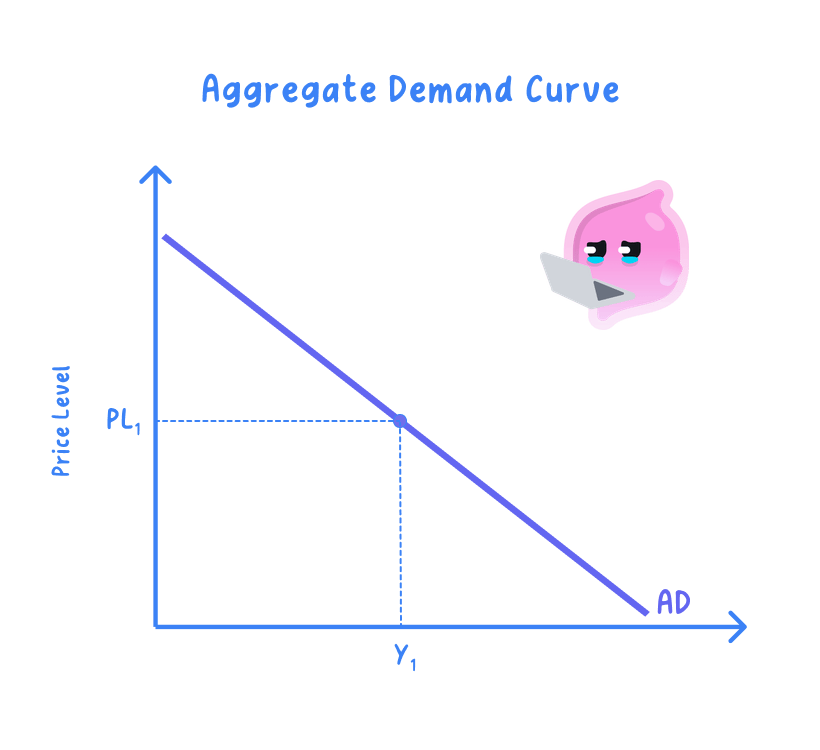
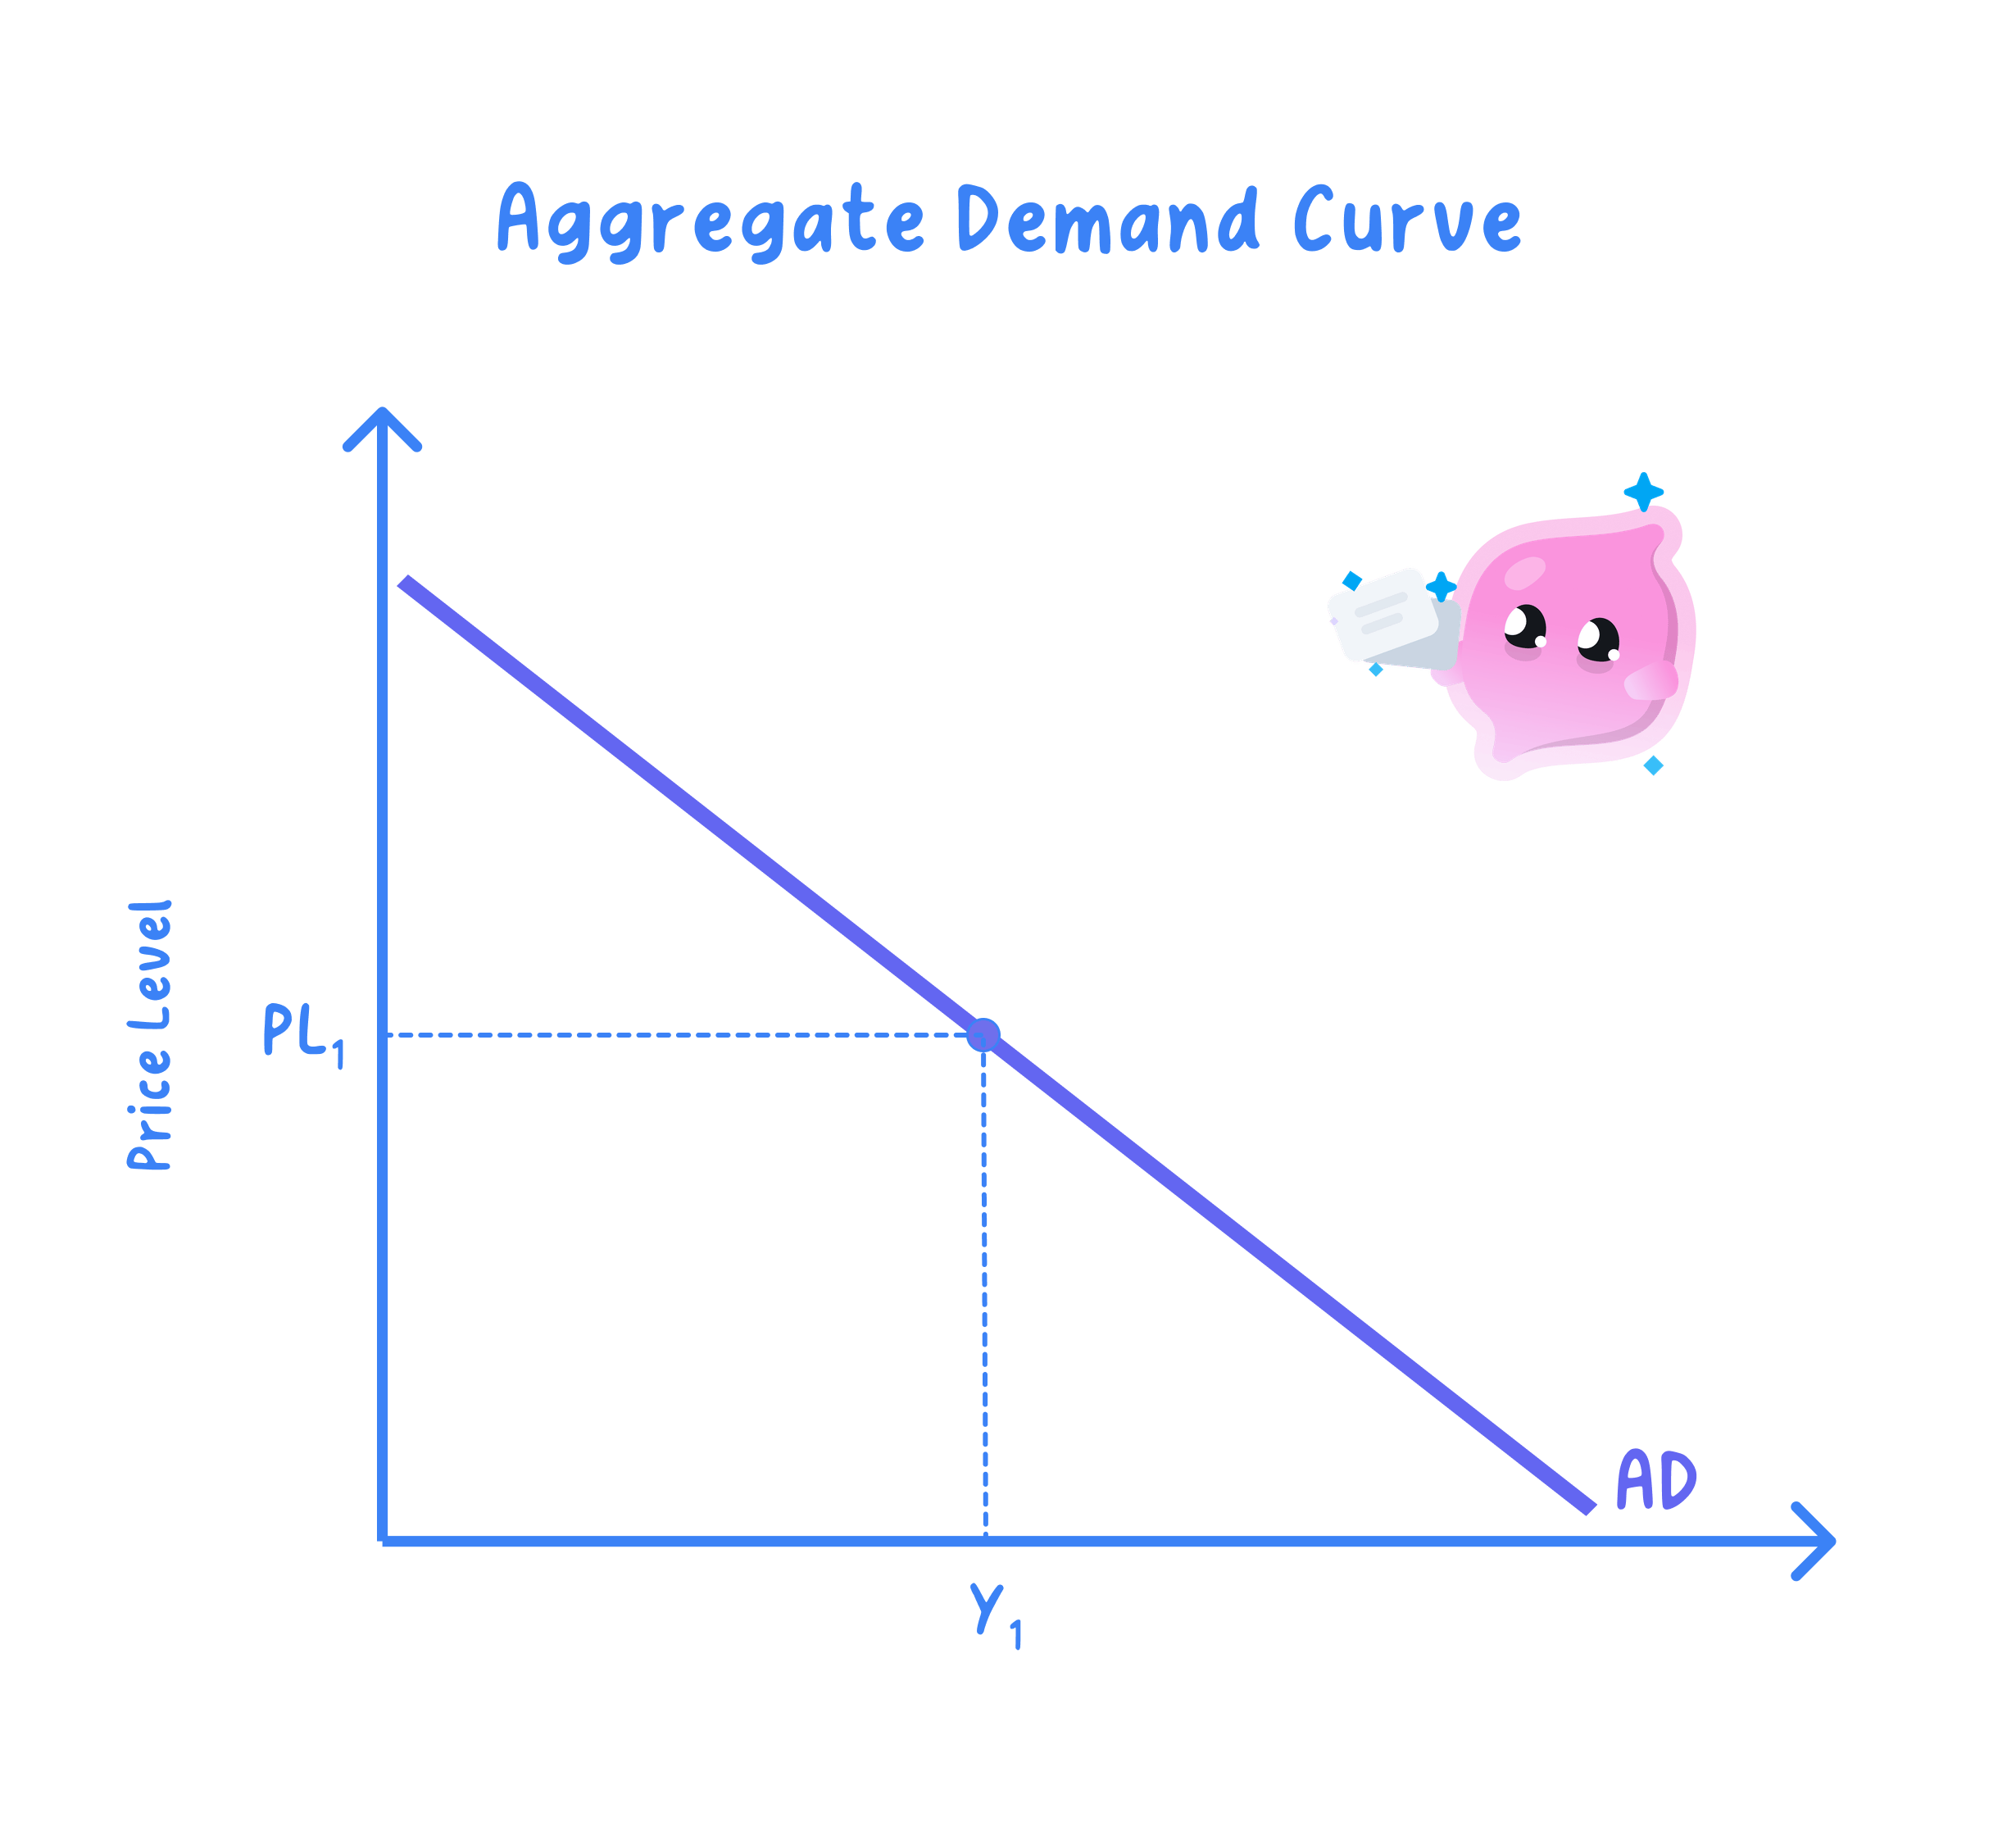
AD curve: a curve showing the total real output demanded at each average price level, drawn with the average price level on the vertical axis and real output (real GDP) on the horizontal axis.
- The AD curve slopes downwards, so a lower average price level is linked to a higher quantity of real output demanded.
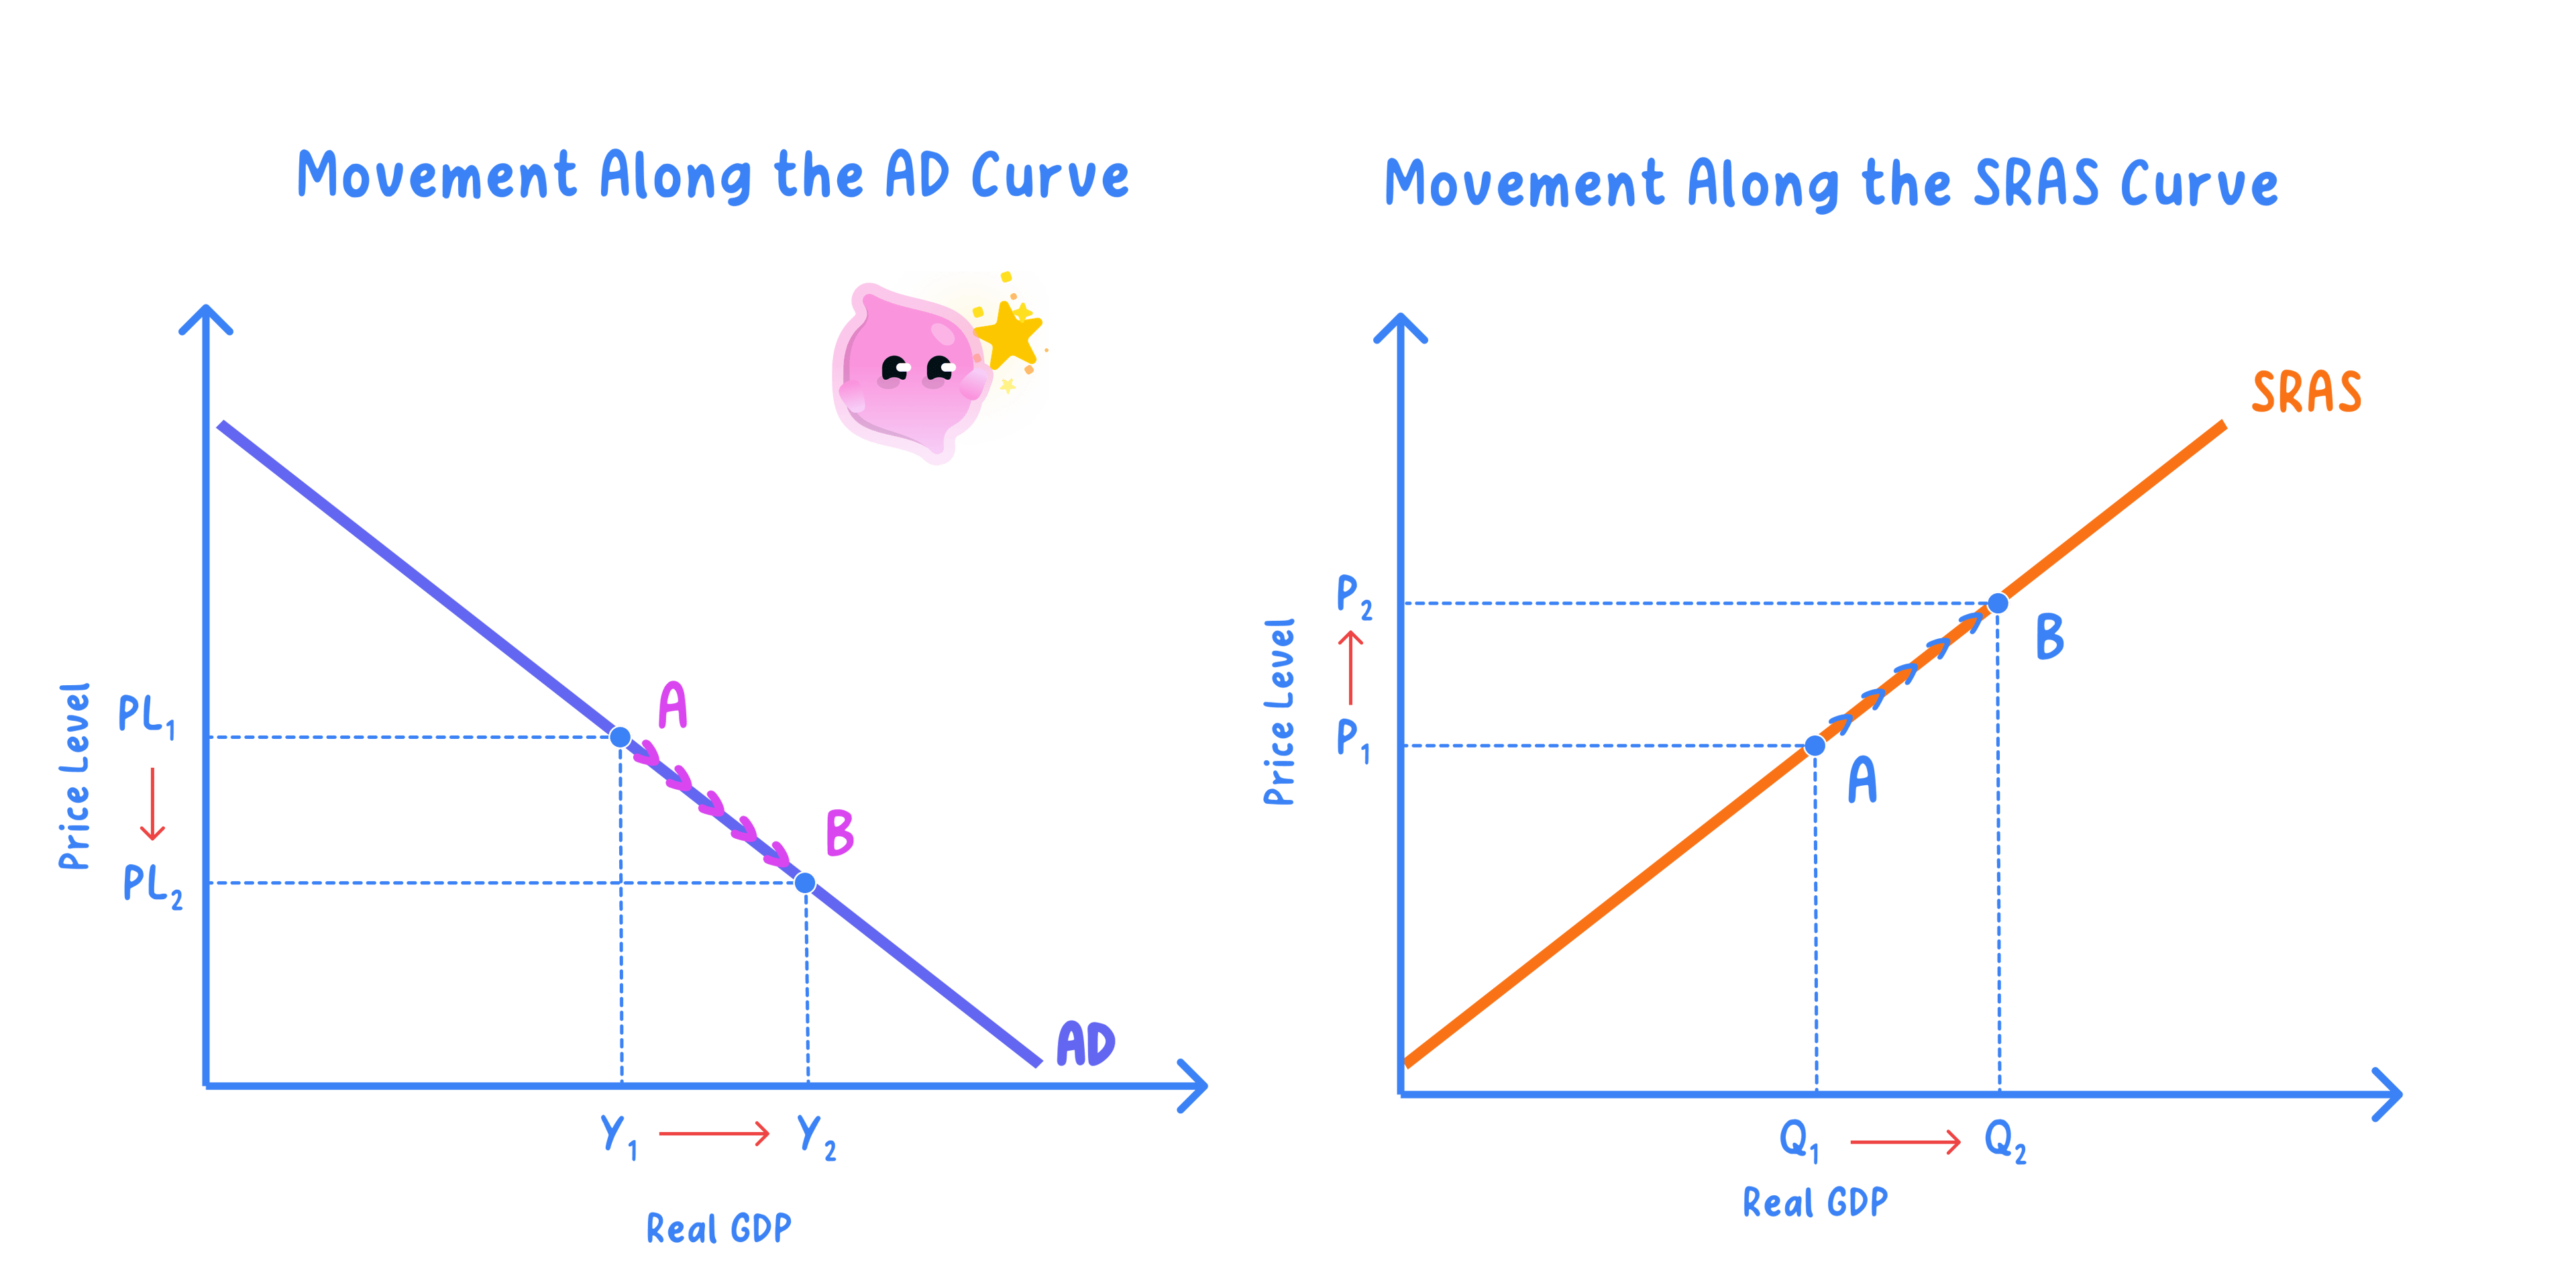
- Because it plots real output against the price level, a price-level change traces a move along the curve, while anything else that alters spending shifts the whole curve.
Why AD slopes down
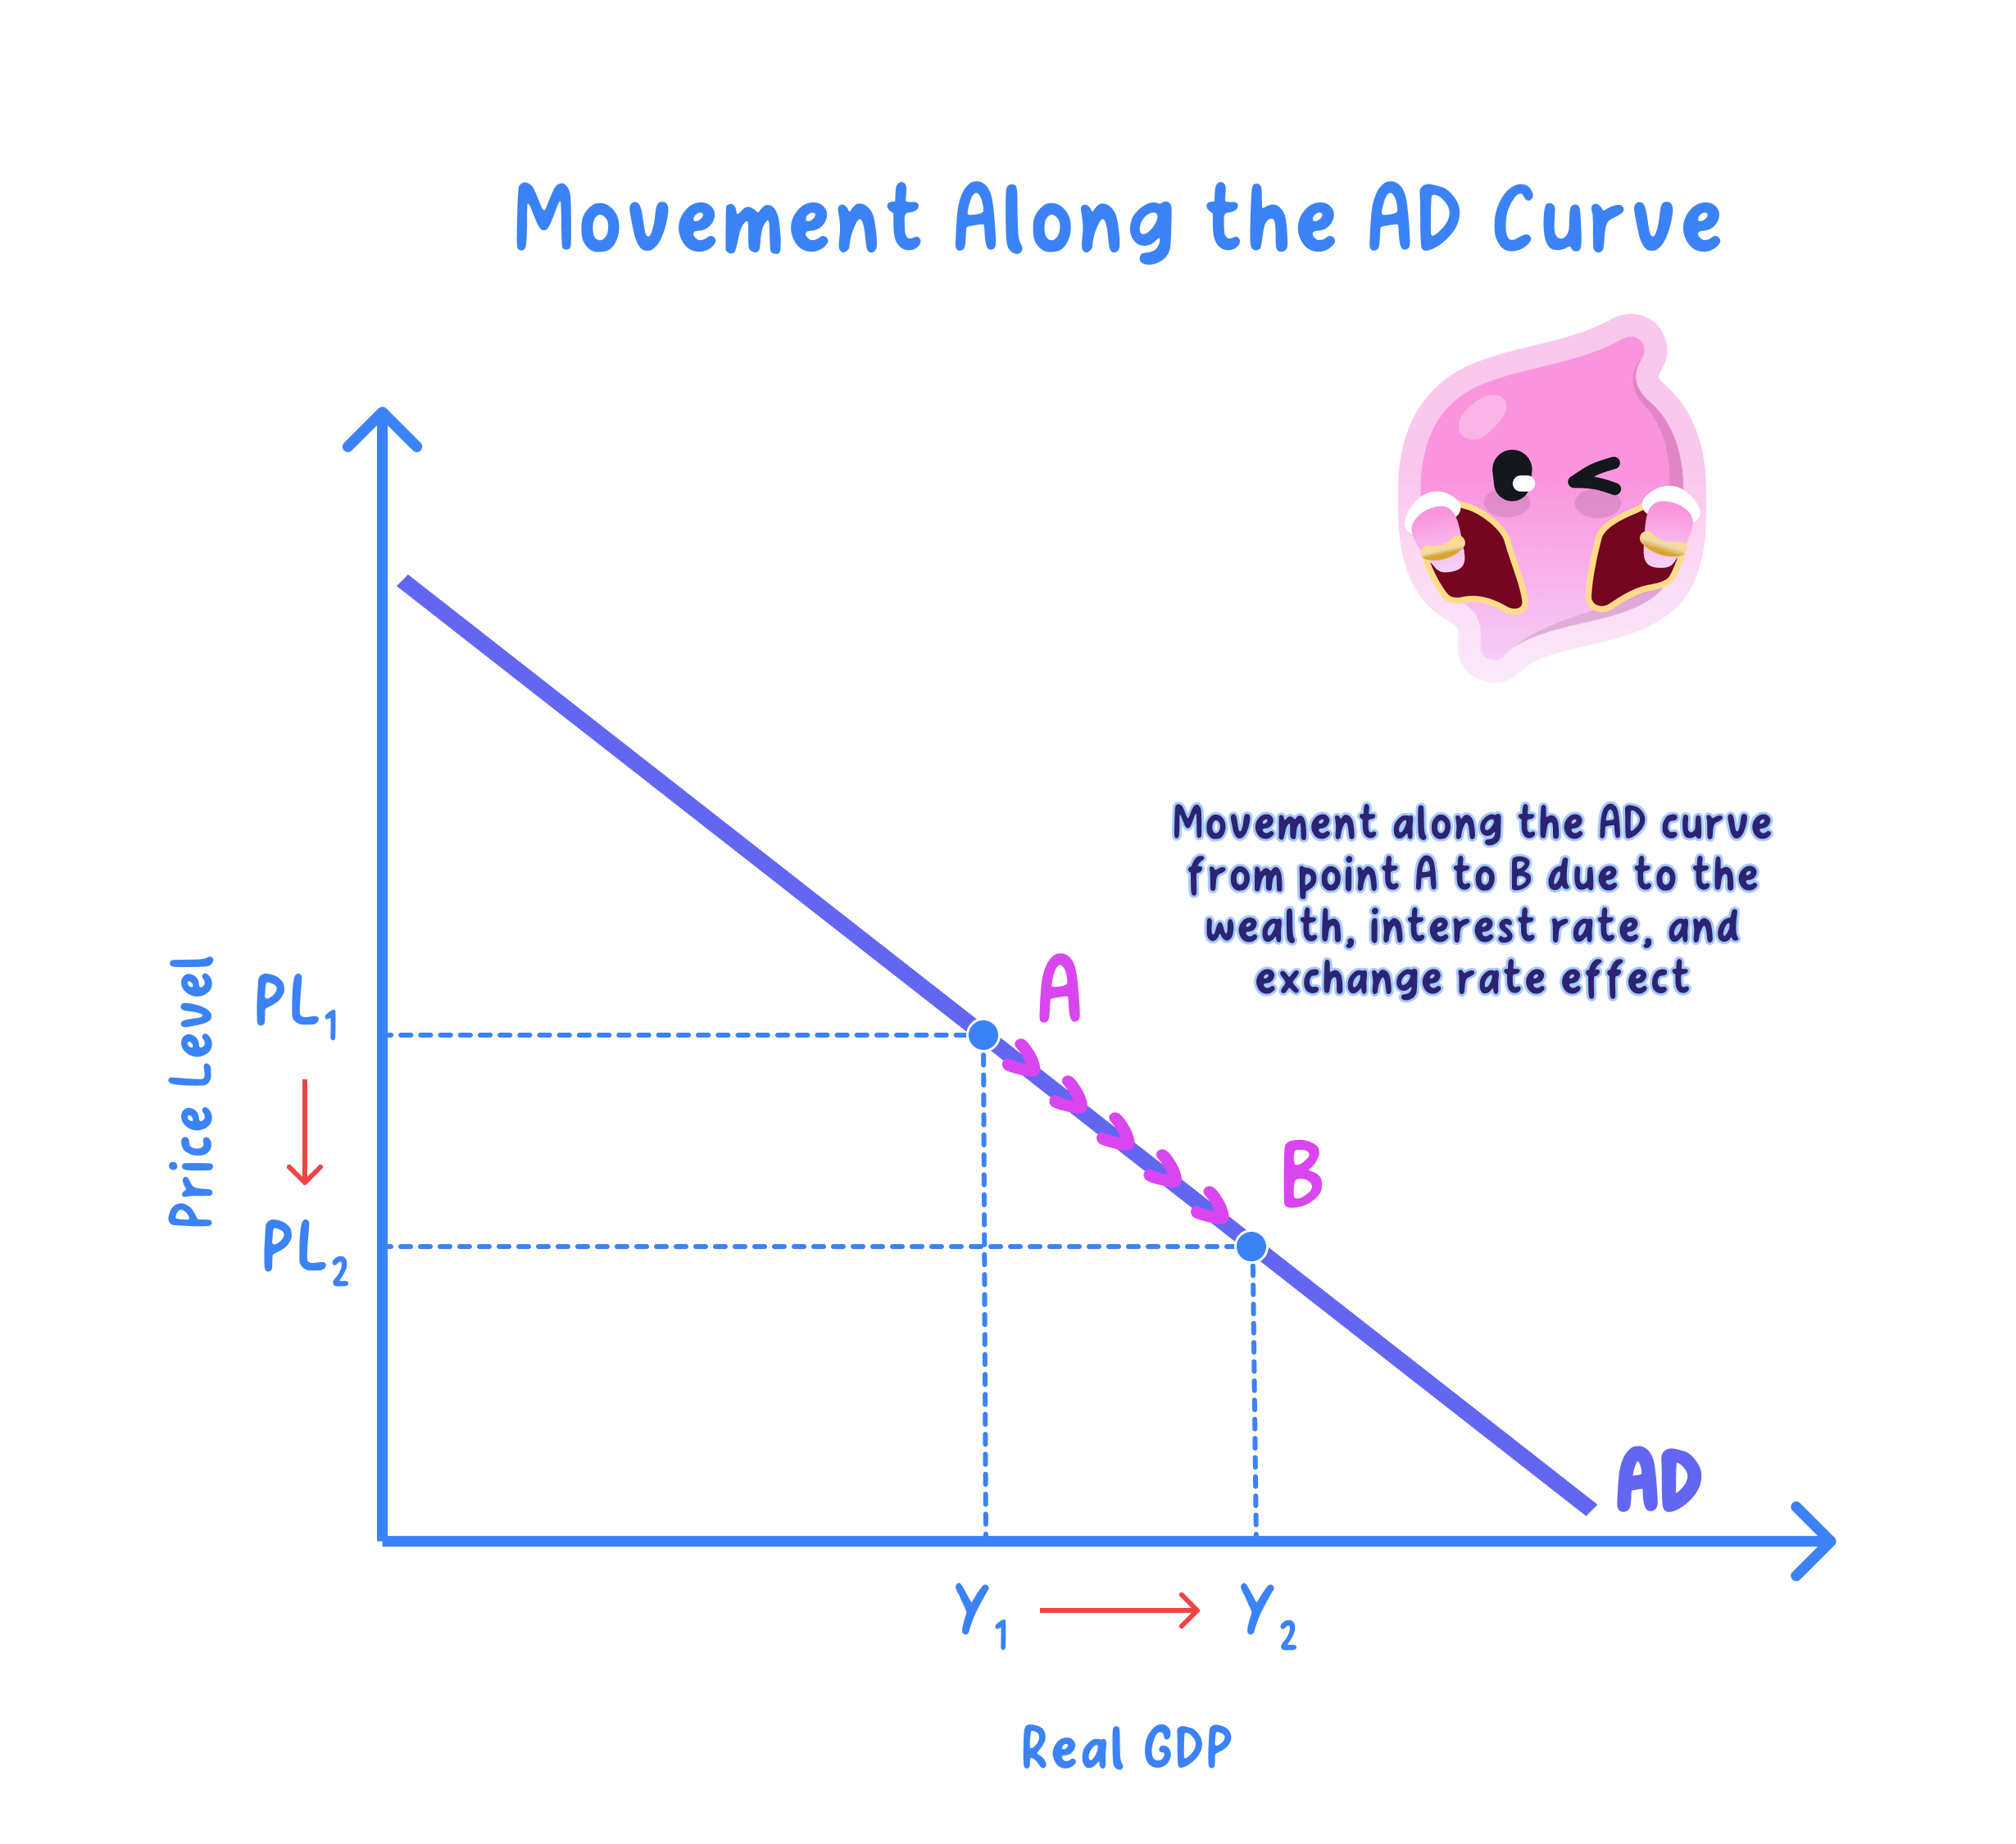
Wealth effect: a lower price level raises the real value of money and savings, so households feel richer and spend more.
Trade (net export) effect: a lower domestic price level makes UK exports cheaper abroad and imports dearer at home, raising net trade.
Interest rate effect: a lower price level reduces the demand for money, lowering interest rates and encouraging borrowing and spending.
- All three effects raise the real output demanded as the price level falls, which is why the curve slopes down rather than shifting.
- In practice the interest rate effect matters most for the UK, because the Bank of England steers demand through Bank Rate, the cost of borrowing that drives consumption and investment.
Movements and shifts
Movement along AD: a change in real output demanded caused only by a change in the average price level.
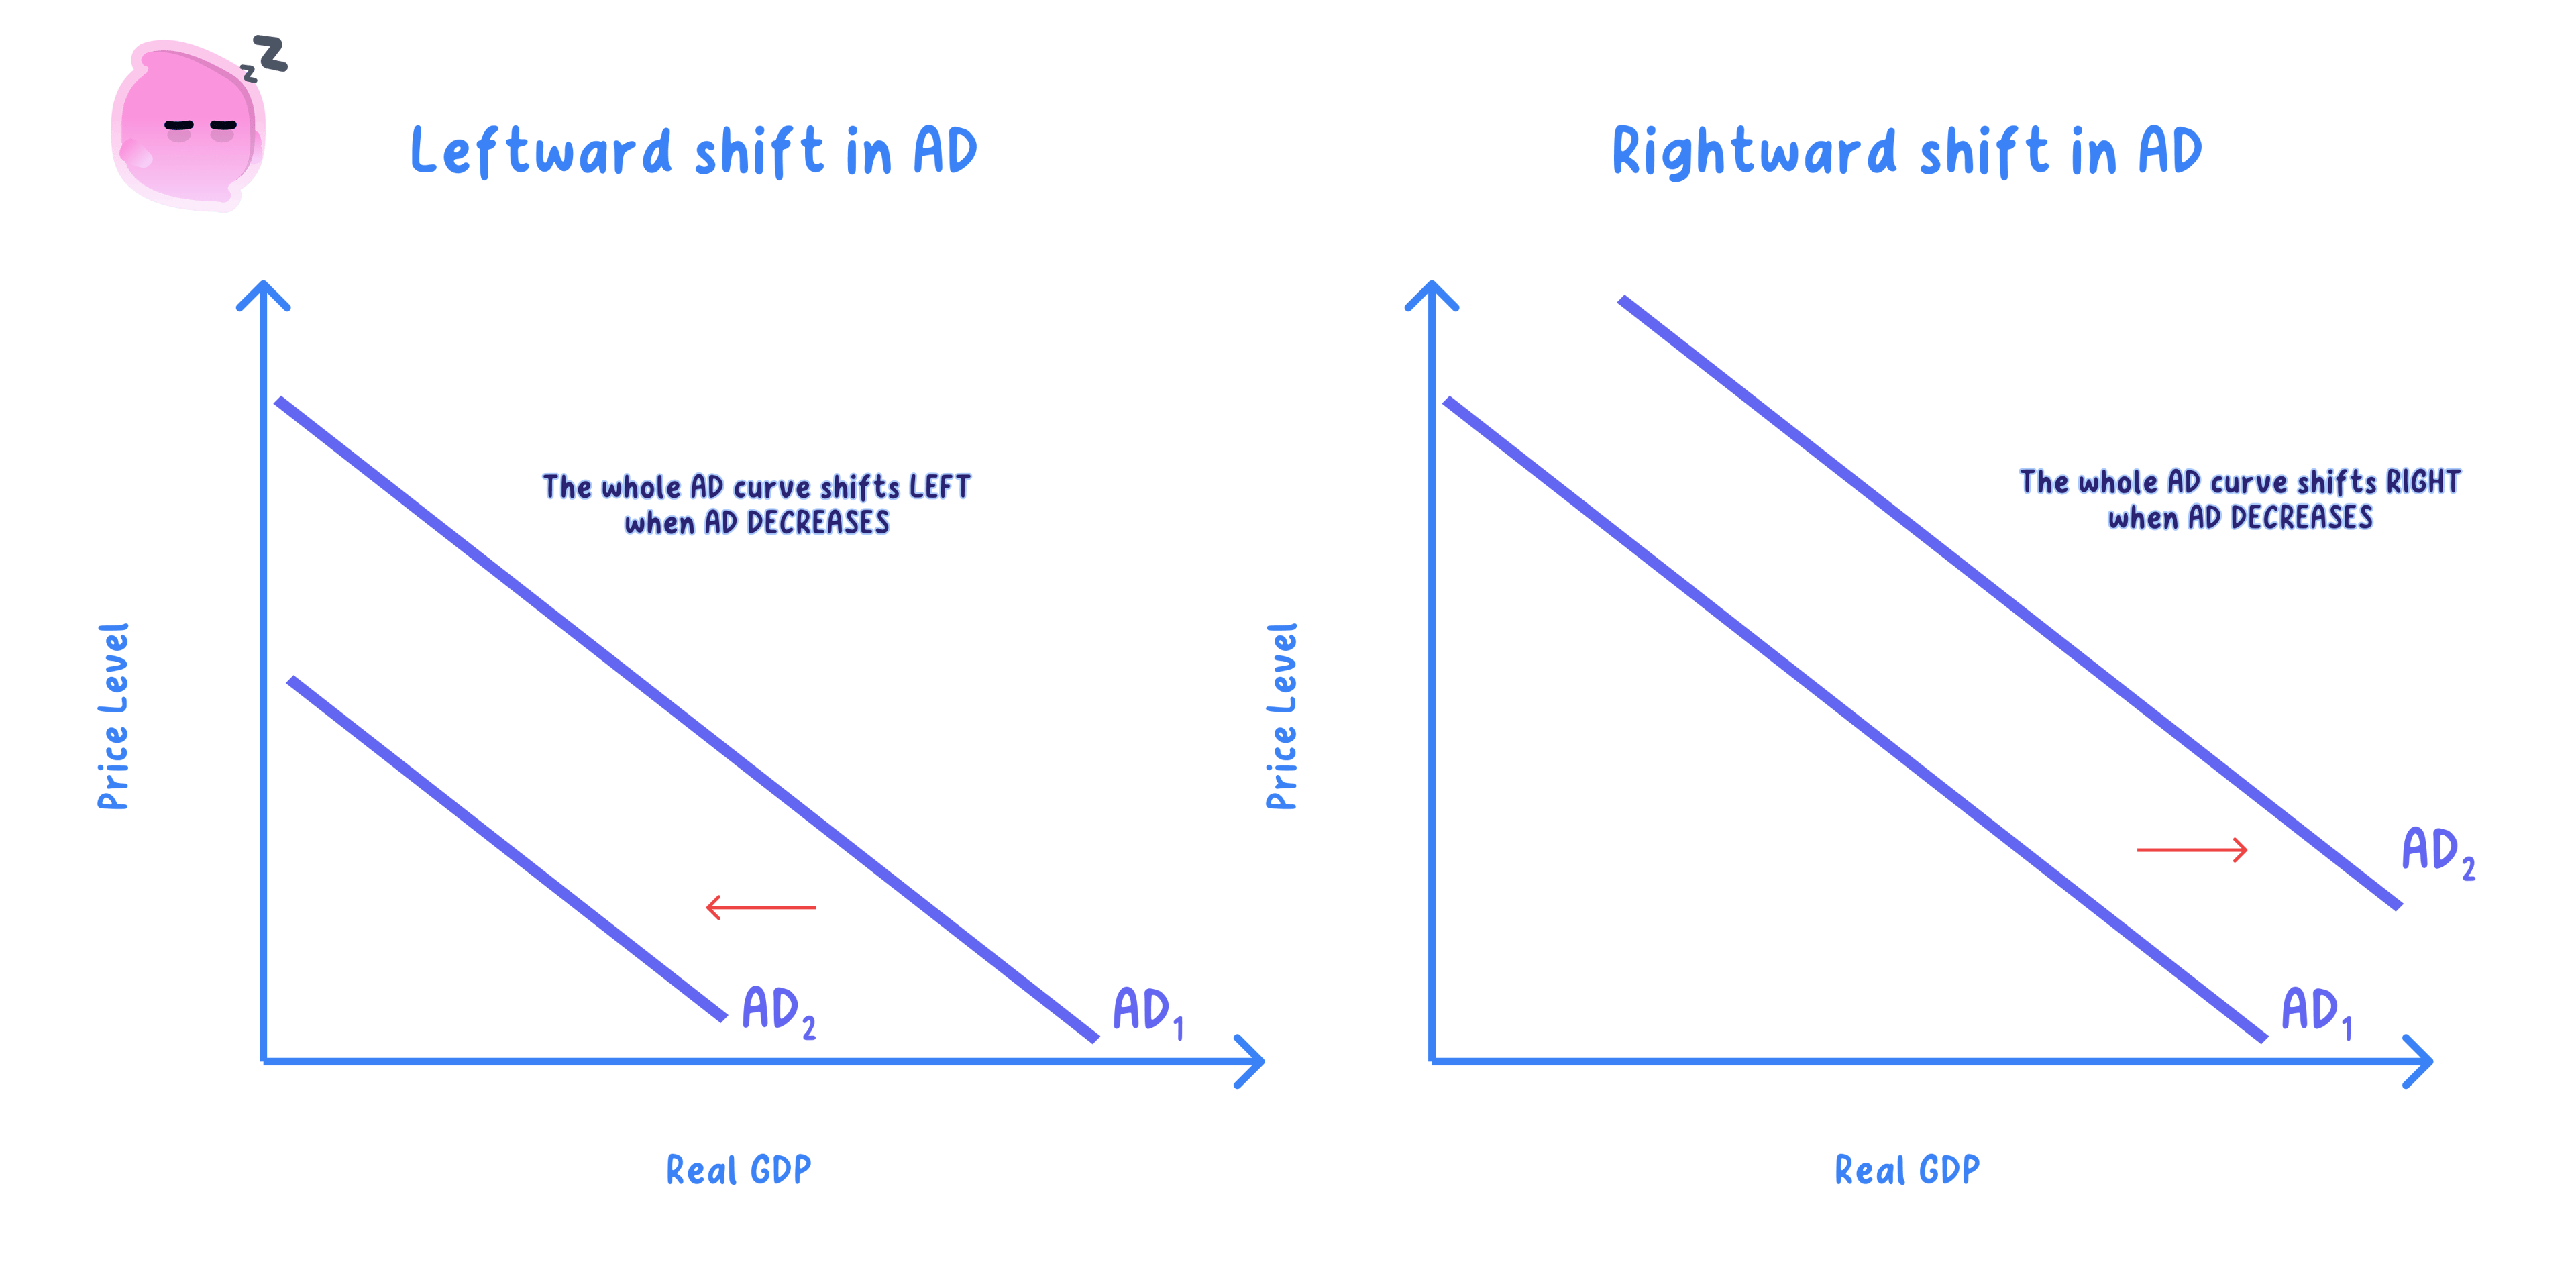
Shift of AD: a change in planned spending at every price level, caused by a change in C, I, G or net trade.
- A movement stays on the same curve because only the price level has changed, leaving the underlying components untouched.
- A shift redraws the curve: a rise in spending shifts AD right and a fall shifts it left, for example the Bank of England's cuts in Bank Rate to 0.1% in 2020 lowered borrowing costs, raised C and I and shifted AD to the right.
Which component of AD matters most?
- It holds that consumption matters most because at around 60% of AD even a small % change moves total demand more than a large change in the smaller components.
- But investment can matter more at turning points, because it is the most volatile component and its collapse drove much of the fall in AD during the 2008-09 recession.
- On balance it depends on the time horizon: consumption dominates the level of AD, but swings in investment and net trade often drive year-to-year fluctuations.
- Label AD diagram axes as average price level and real output, not price and quantity.
- State AD = C + I + G + (X − M) early to anchor macro analysis.
- Do not confuse a movement along AD, caused by a price-level change, with a shift of AD, caused by a component change.
- Remember that UK net trade is usually negative, so it subtracts from AD.
- What are the four components of AD, and what does each measure?
- Which component is the largest share of UK AD, and why?
- Why does the AD curve slope downwards?
- What is the difference between a movement along and a shift of the AD curve?
