Macroeconomic Equilibrium
Definition
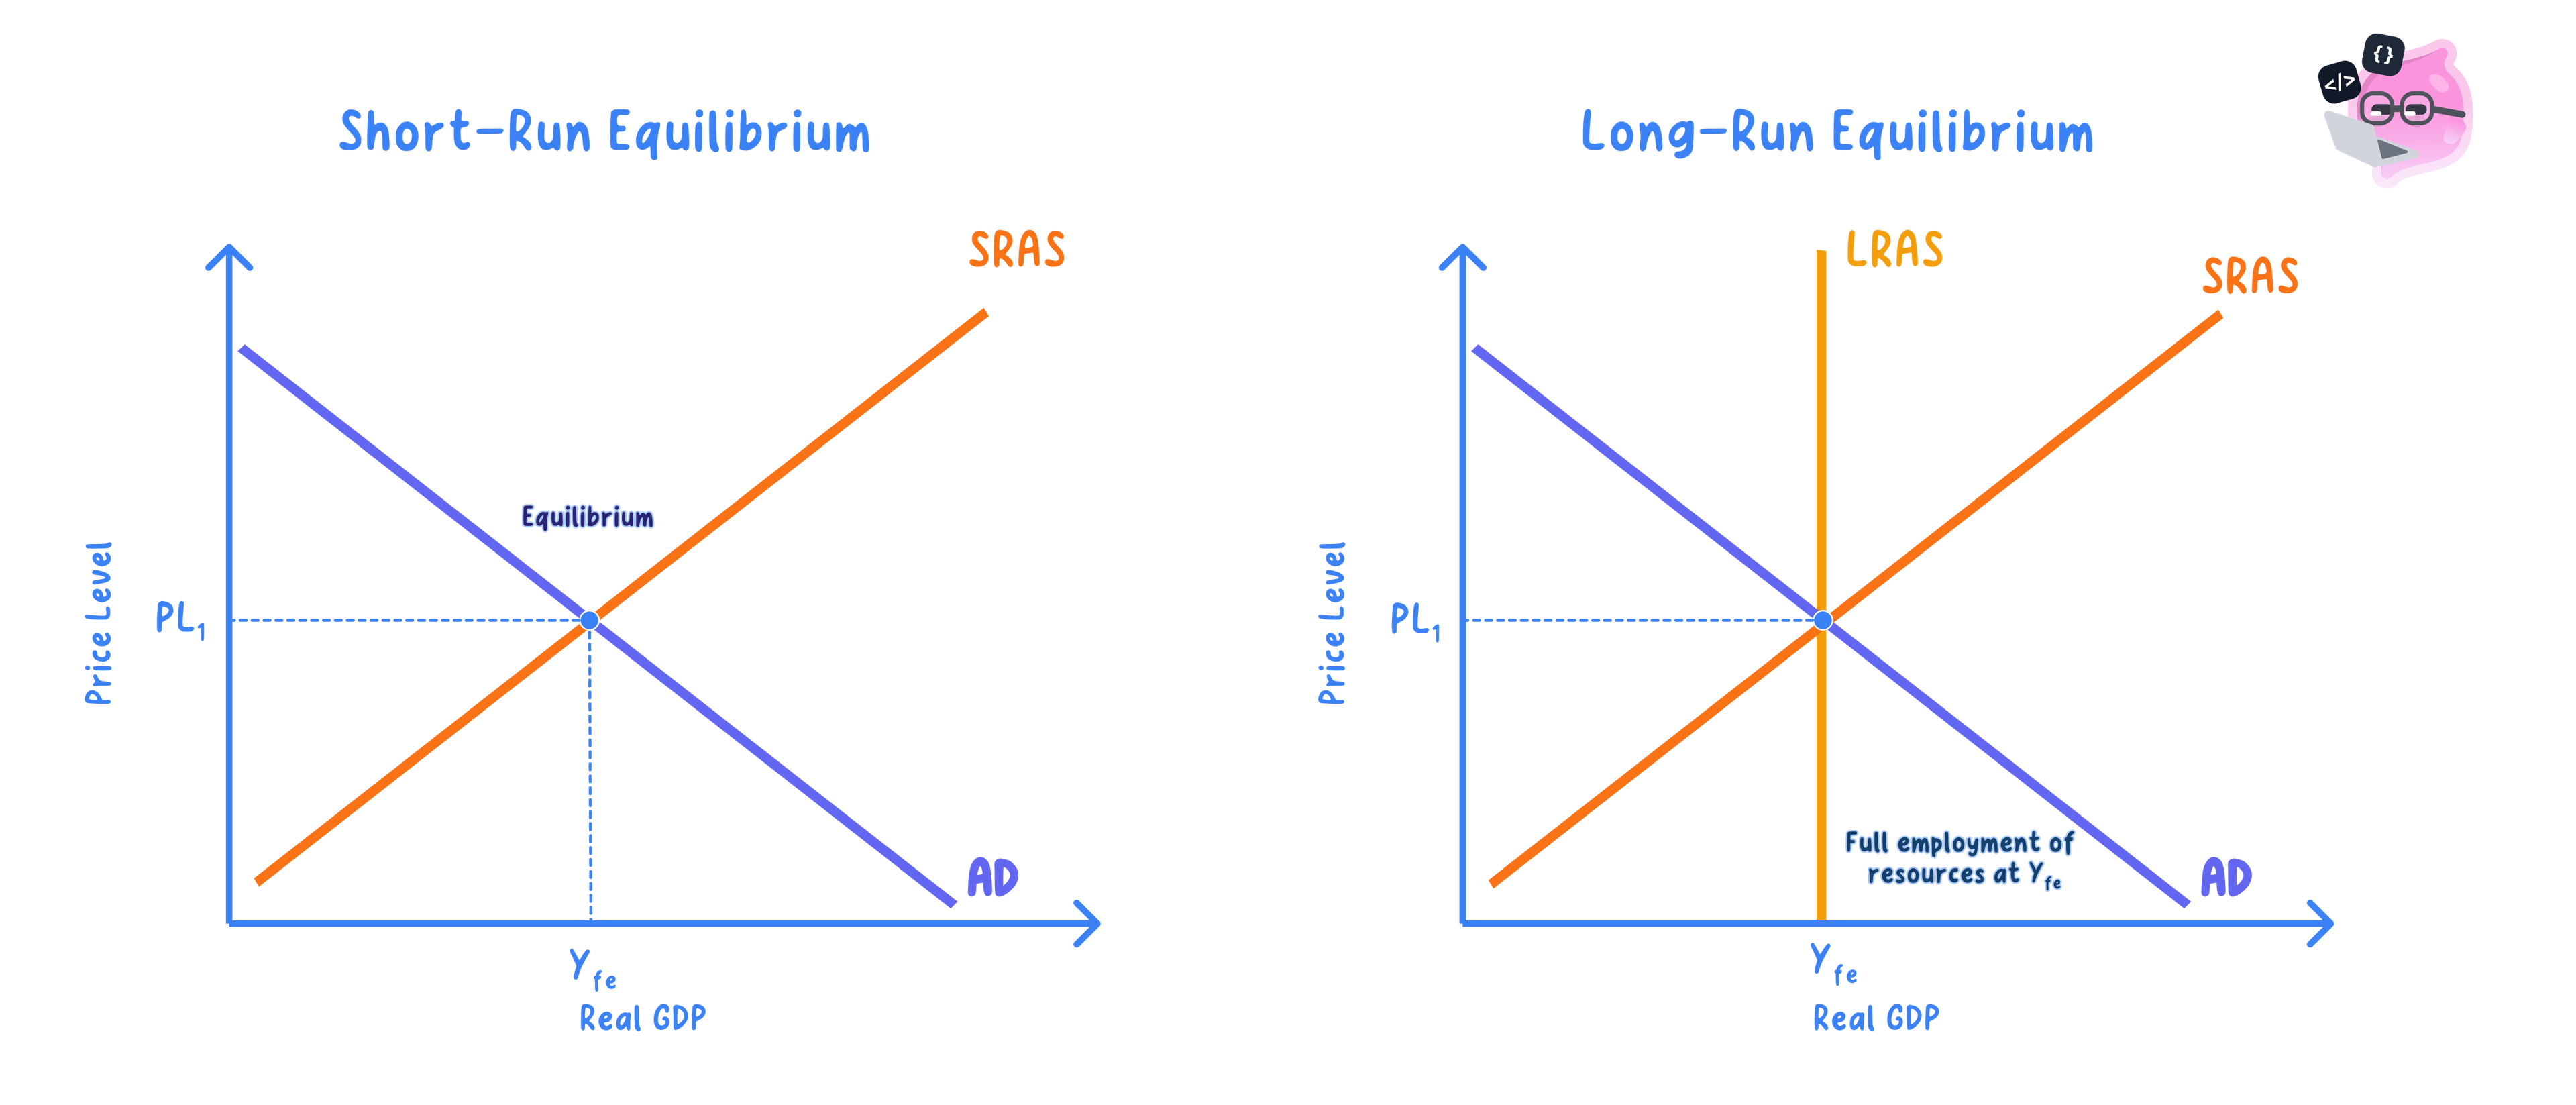
Equilibrium real national output: the level of real output at which aggregate demand equals aggregate supply, so there is no tendency for output to change.
Full employment output: the level of real output at which all available resources are fully employed; equilibrium output need not equal it.
- At equilibrium, planned spending matches planned output, so firms have no reason to change production and the level is stable.
- In circular-flow terms this is where planned injections equal planned withdrawals.
- This equilibrium can settle below, at or above the full employment level of output.
The AD/AS Diagram
Definition
Aggregate demand (AD): total planned spending on domestic output at each price level; the curve slopes downward.
Aggregate supply (AS): total planned output firms supply at each price level; the short-run curve slopes upward.
- The vertical axis shows the average price level and the horizontal axis shows real output.
- The downward-sloping AD curve and the upward-sloping AS curve cross at the equilibrium price level and real output.
- Reading the diagram means tracing both the price level and real output across from the intersection.
Shifts in AD
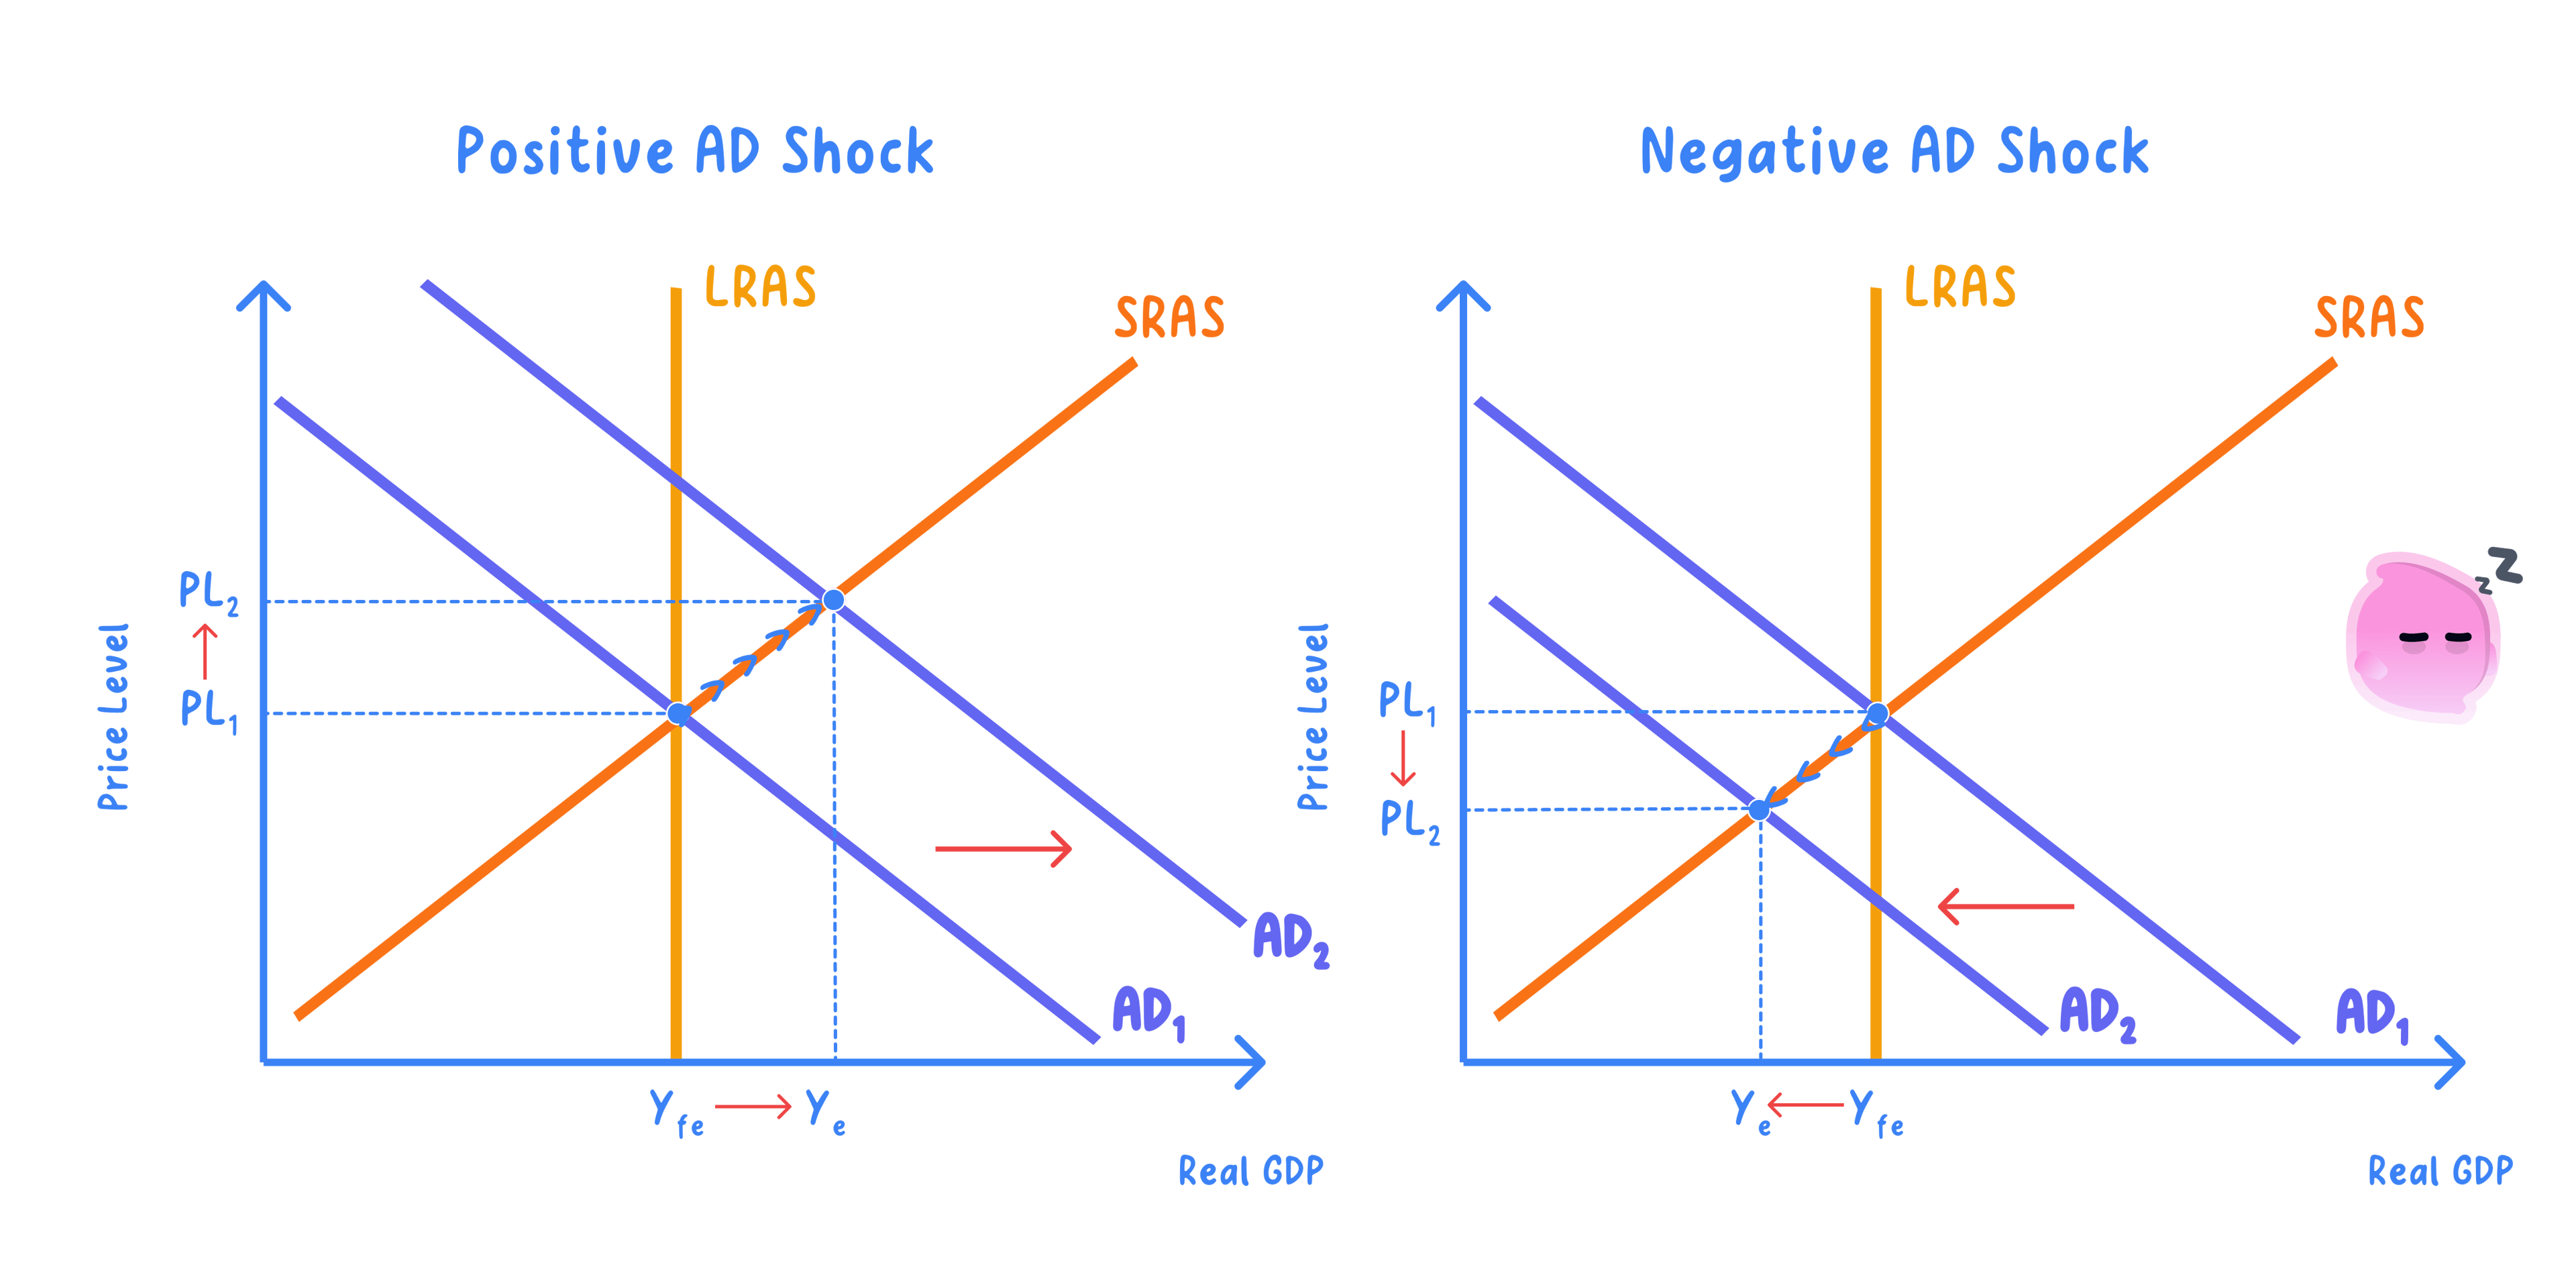
- A rightward AD shift, from higher consumption, investment, government spending or net exports, raises equilibrium output and the price level.
- A leftward AD shift lowers equilibrium output and the price level and tends to raise unemployment.
- The size of the output and price effects depends on the shape of the AS curve.
Example
- A Bank of England cut in interest rates that lifts consumption and investment shifts AD to the right.
- With spare capacity this raises real output with only a small rise in the price level.
Shifts in AS
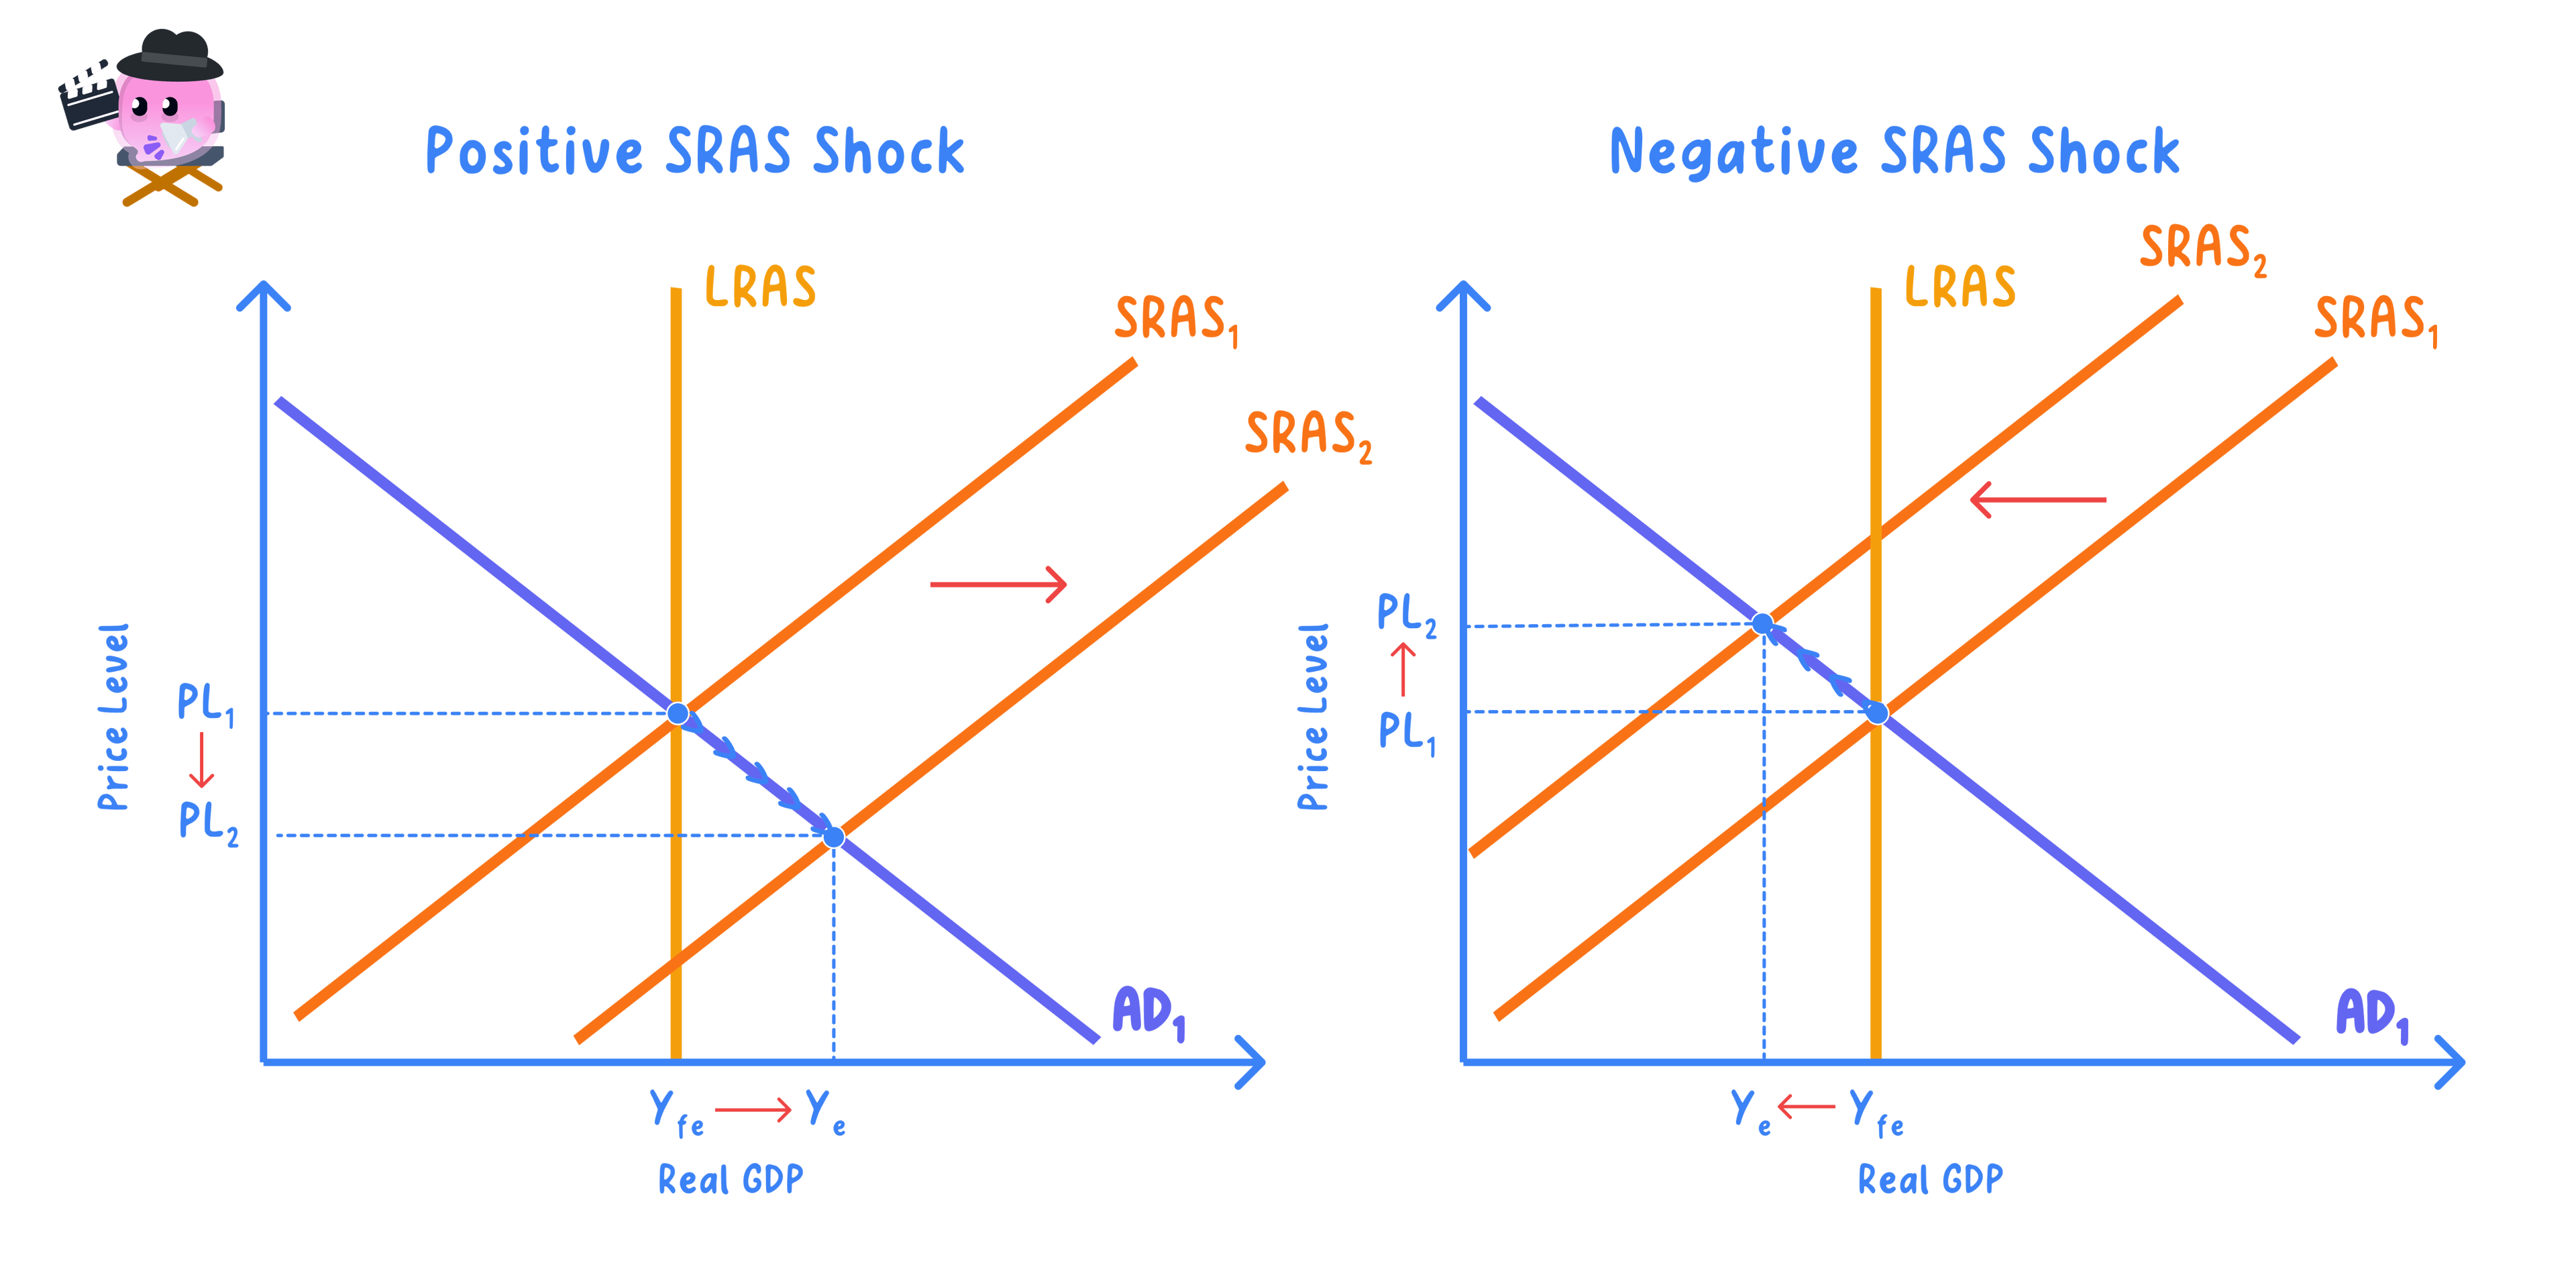
- A rightward AS shift raises equilibrium real output while easing the price level.
- A leftward AS shift lowers real output and raises the price level.
- A rightward LRAS shift raises potential output and supports long-run growth.
Example
- The 2022 surge in global energy and commodity prices shifted short-run AS to the left, raising the UK price level while lowering real output, a stagflationary squeeze.
- By contrast, sustained investment in skills and new technology shifts LRAS to the right, raising potential output over time.
Key Idea
- On a flat, spare-capacity section of AS a rise in AD mainly raises output with little inflation.
- Near full capacity a rise in AD mainly raises the price level.
Equilibrium and Full Employment
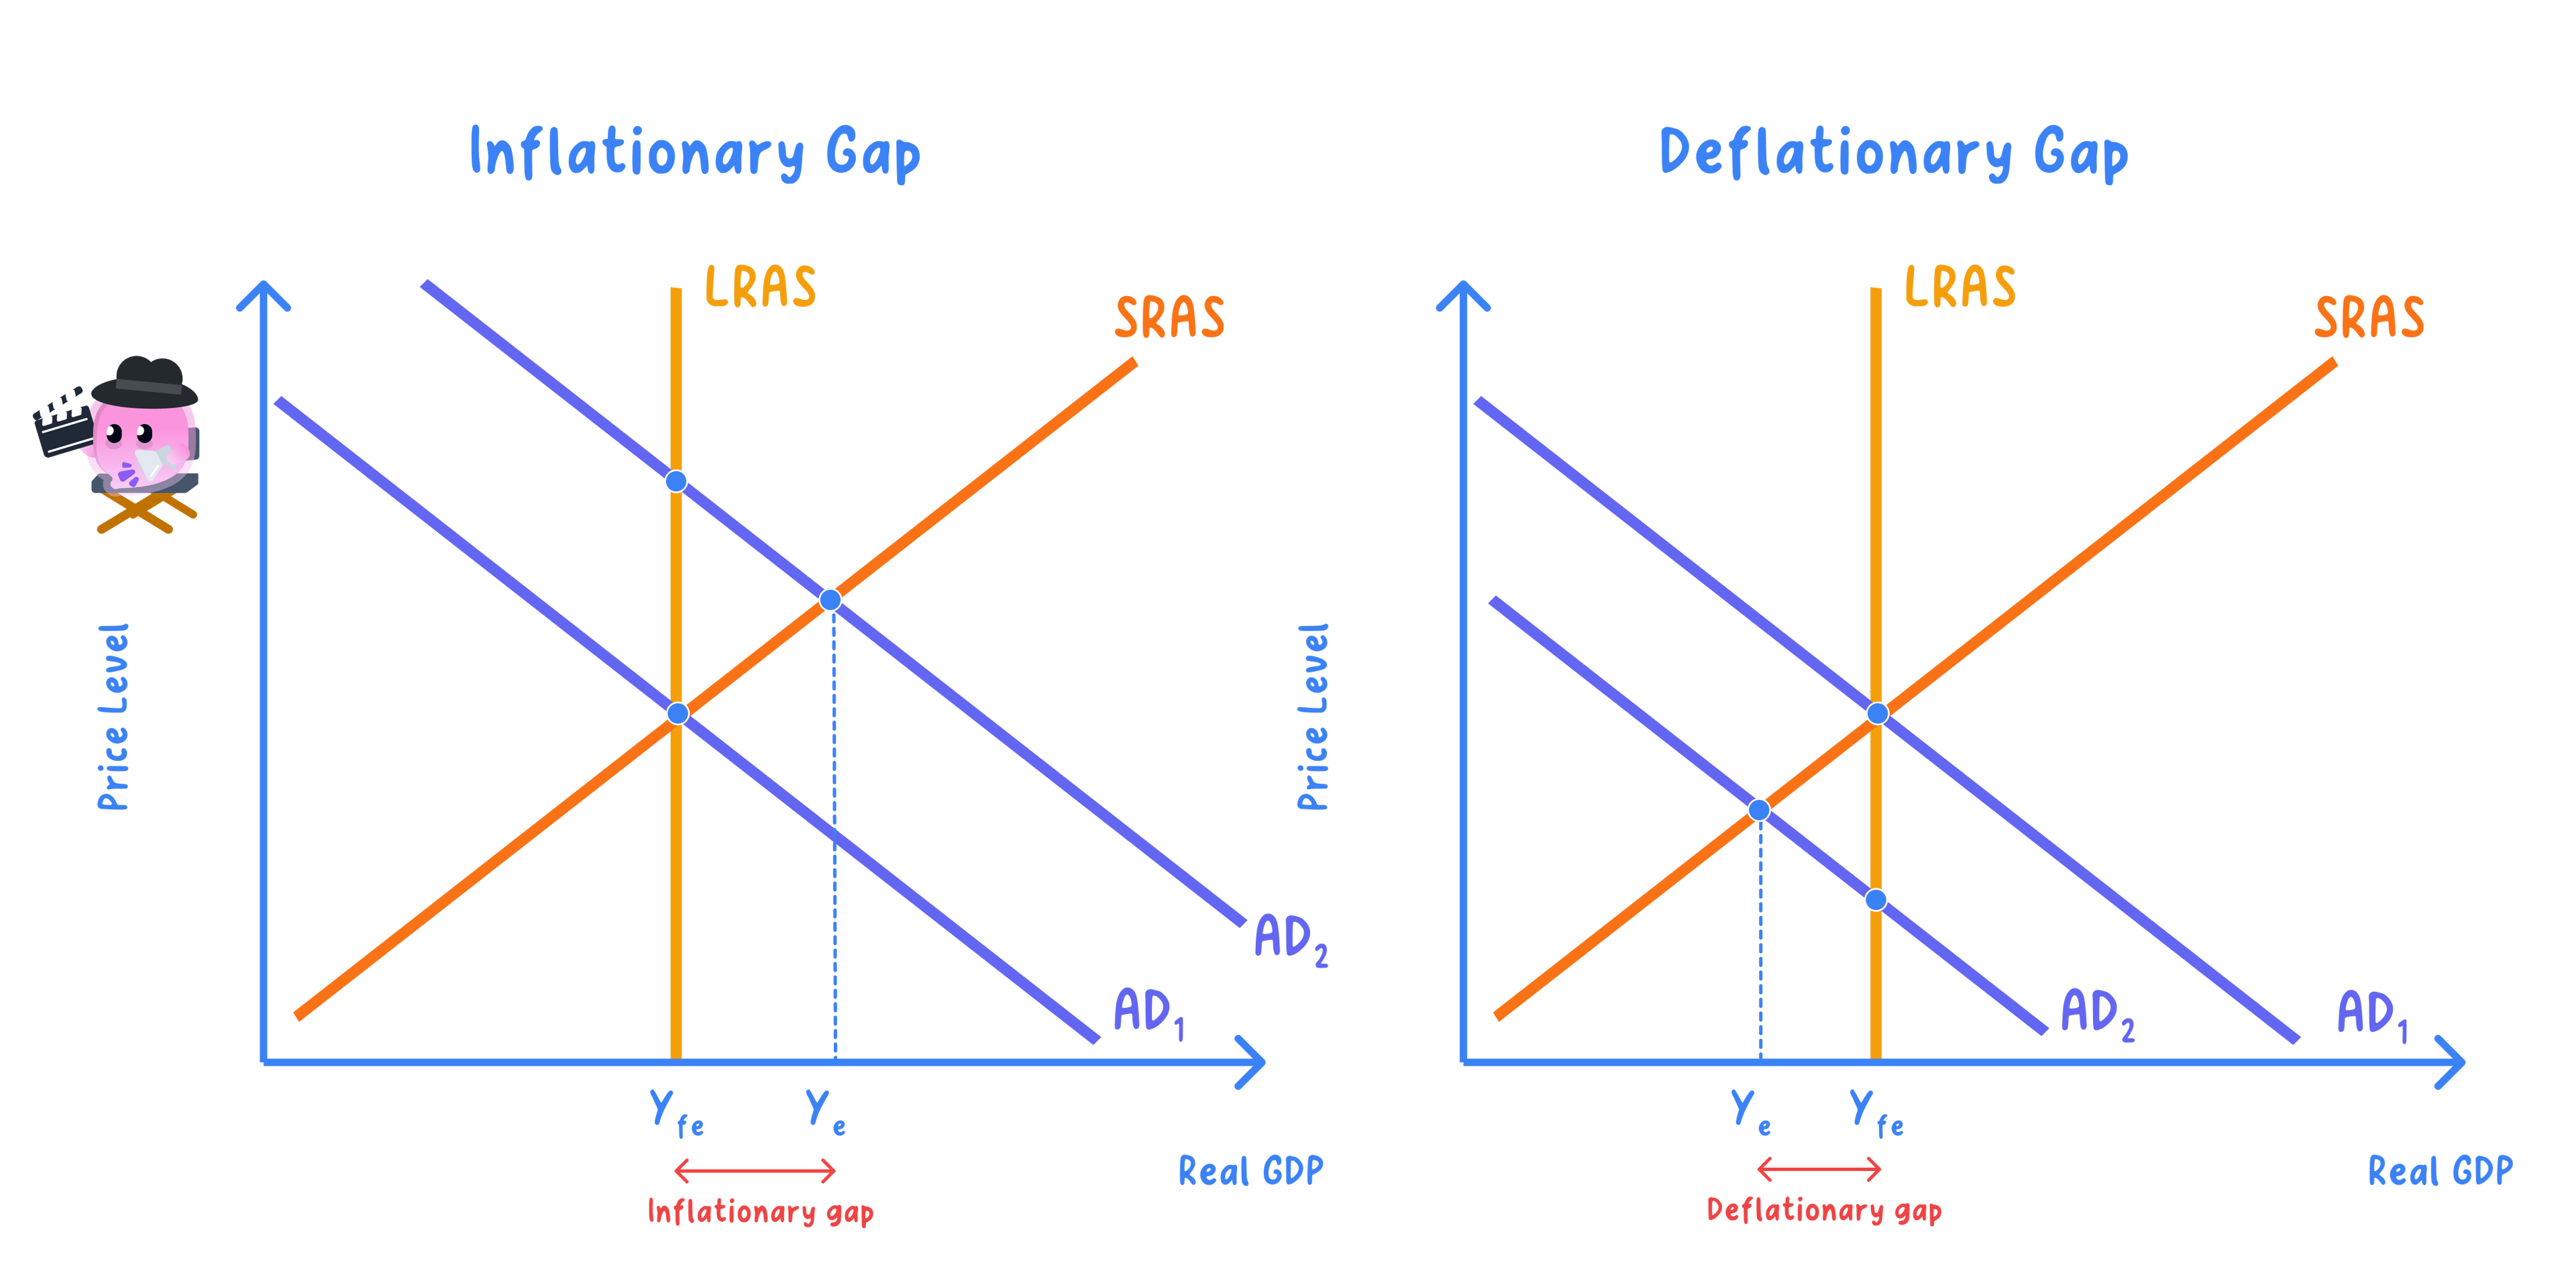
- Equilibrium sits wherever AD meets AS, which can be below, at or beyond full employment.
- Below full employment, spare capacity remains and unemployment is higher.
- This spare-capacity idea is developed as output gaps in 2.5.2.
Does a rightward AD shift raise output or just prices?
- It holds because, with spare capacity, a rightward AD shift brings idle resources into use and raises real output with only a small rise in the price level.
- But near full capacity the same shift mainly raises the price level, because firms cannot easily expand output.
- On balance, whether the shift raises output or prices depends on the amount of spare capacity and the shape of the AS curve.
Exam technique
- Label the axes average price level and real output, and state the effect on both.
- Tie the size of the price effect to the shape of AS and the economy's starting point.
Common Mistake
- Do not read the diagram only for output and ignore the price level.
- Do not assume equilibrium output equals full employment output.
Self review
- What is the equilibrium level of real national output?
- What are the two axes of an AD/AS diagram?
- How does a rightward AD shift affect output and the price level?
- How does a rightward AS shift affect output and the price level?
- Why does the price-level effect depend on the shape of AS?
