Revision notes for AQA A Level Computer Science Big Data. Open the guide for explanations and worked examples. Written against the AQA A Level Computer Science specification, so the content matches what's examinable rather than general Computer Science background.
Big Data
What you'll learn
- What makes data “Big Data”: volume, velocity and variety.
- Why very large, messy datasets do not fit neatly into ordinary relational databases.
- How distributed processing and functional programming help when one server is not enough.
- How fact-based models and graph schemas represent complex data using nodes, edges and properties.
4.11.1 Big Data
Starting point: ordinary data storage
Before Big Data, it helps to picture a normal database system.
A server is a computer that provides services or data to other computers. In a small or medium system, one server might store the whole database and run all the processing.
A relational database stores data in tables made of rows and columns. This works very well when the data is structured, meaning it has a predictable format: for example, a customer table where every record has fields such as customer ID, name, email address and postcode.
Definition
Relational database
A relational database stores data in relations, usually shown as tables. Each row is a record, and each column is an attribute.
Big Data becomes interesting when this neat picture breaks down: the data may be too large, too fast-moving, or too varied to fit comfortably into one server and one table-based design.
What Big Data means
Definition
Big Data
Big Data is a catch-all term for data that will not fit the usual containers, such as a single-server database or a simple row-and-column structure.
“Big” is a relative term. There is no fixed number of gigabytes or terabytes where data suddenly becomes Big Data. In this specification, size matters especially when the data does not fit onto a single server, because the storage and processing must then be spread across multiple machines.
Big Data is commonly described using three ideas: volume, velocity and variety.
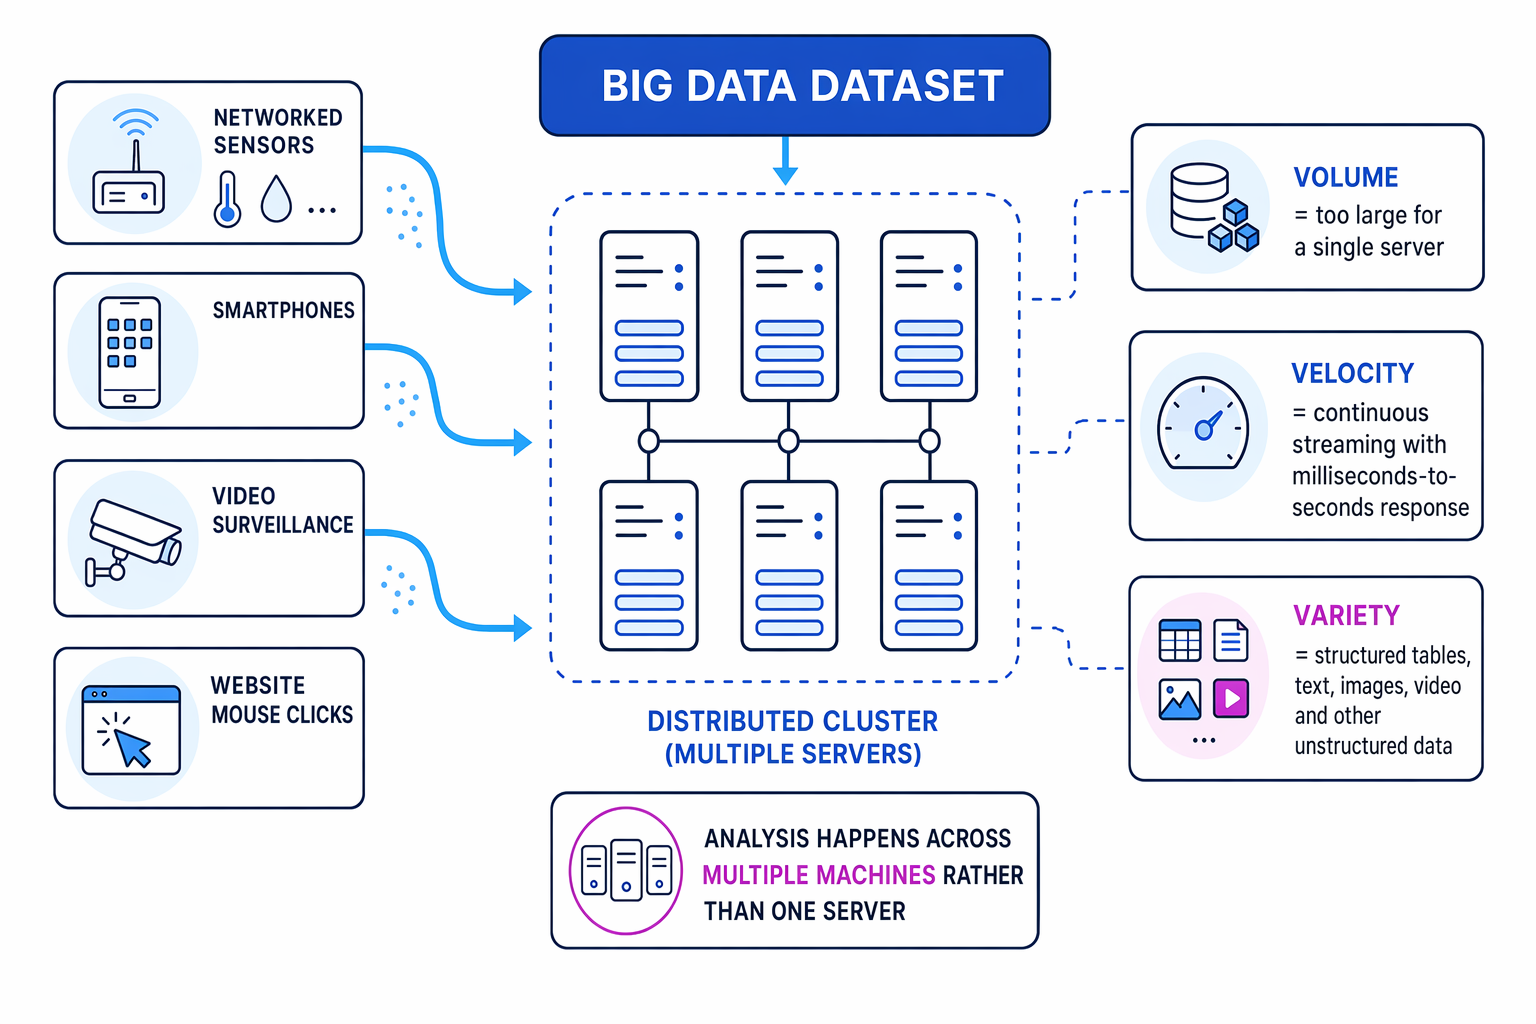
Volume: too big for one server
Volume means the amount of data is so large that it cannot be stored or processed conveniently on a single server.
This might happen with years of video surveillance footage, logs from millions of users, or sensor readings collected every second from thousands of devices.
Velocity: data arrives quickly
Velocity means data is continuously arriving and must often be processed quickly, sometimes within milliseconds to seconds.
Examples include networked sensors, smartphone location updates, website mouse clicks, financial transactions and live monitoring systems.
Variety: data comes in many forms
Variety means the data appears in different formats. Some may be structured tables, but other data may be unstructured, meaning it does not naturally fit into rows and columns.
Examples include text, images, audio, video, click streams, GPS readings and messages.
Key Idea
The three Vs
Big Data is not just “a very large file”. You should describe it using volume because it may not fit on one server, velocity because it may arrive continuously, and variety because it may include structured and unstructured data.
Example
Classifying a transport dataset
A city transport system stores bus GPS updates every 2 seconds, CCTV footage from stations, ticket payments and passenger feedback messages. It needs congestion predictions within a few seconds.
-
Check volume: the CCTV footage and long-term GPS history are likely too large for one ordinary server, so the dataset has high volume.
-
Check velocity: GPS updates and ticket events arrive continuously, and congestion predictions are needed within seconds, so the dataset has high velocity.
-
Check variety: the system stores structured ticket records, location readings, free-text feedback and video footage, so the dataset has high variety.
-
Classify the situation: because all three Vs apply, this is a strong example of Big Data rather than just a normal database problem.
Why variety is often the hardest part
Although size gets a lot of attention, the most difficult aspect of Big Data is often its lack of structure.
Structured data is relatively easy to query because each item has known fields. Unstructured data is much harder to analyse because the important meaning may be hidden inside text, images, video or sound.
For example, a relational database can easily store:
- customer ID
- order number
- date
- total cost
It is much harder to store and analyse:
- a product review written in natural language
- a video clip showing traffic conditions
- a photo uploaded by a user
- mouse movements across a web page
Relational databases are not always appropriate for this because they expect the data to fit into a row-and-column format. They also do not scale as naturally across many machines as some Big Data approaches.
Definition
Machine learning
Machine learning uses algorithms that learn patterns from data, rather than relying only on rules explicitly written by a programmer.
Machine learning techniques are often needed in Big Data because they can help discern patterns and extract useful information from messy, varied datasets.
For example, machine learning might be used to classify images, detect unusual sensor readings, recognise speech, recommend products or identify suspicious behaviour in transaction data.
Common Mistake
Thinking Big Data only means large data
Do not define Big Data only as “lots of data”. A stronger answer refers to volume, velocity and variety, and explains that unstructured data makes analysis much harder.
When one server is not enough
When data sizes are so big that they do not fit onto a single server, the processing must be distributed across more than one machine.
Definition
Distributed processing
Distributed processing means splitting computation across multiple computers, so that different machines process different parts of the data or problem.
A group of connected servers used together is often called a cluster. Each machine may handle a chunk of the data, then the partial results are combined.
This matters because moving huge raw datasets around a network can be slow. A common Big Data idea is to send processing tasks to where the data is stored, rather than trying to move all the data to one central computer first.
Example
Choosing distributed processing
A company stores 120 TB of website logs. One server can store and process 20 TB effectively. The company wants daily statistics such as page views, search terms and failed login attempts.
-
Compare the dataset with one server’s capacity: 120 TB is greater than the 20 TB that one server can handle effectively, so a single-server design is not suitable.
-
Split the data across machines: the logs can be divided across several servers, with each server processing a different section of the logs.
-
Combine partial results: each server can count page views or failed logins for its own chunk, then the partial counts can be added together.
-
Justify the design: distributed processing is appropriate because the data does not fit comfortably on one machine, and the work can be divided into independent chunks.
Functional programming and Big Data
Functional programming is useful in Big Data because it makes it easier to write correct, efficient distributed code.
Definition
Functional programming
Functional programming is a programming style based on evaluating functions and avoiding changes to shared state.
The AQA specification highlights three features that help:
- immutable data structures
- statelessness
- higher-order functions
Immutable data structures
An immutable data structure cannot be changed after it has been created. If a program needs an updated version, it creates a new version rather than modifying the old one.
This helps correctness because one part of a distributed program cannot unexpectedly alter data that another machine is also using.
Statelessness
A stateless function does not rely on stored information from previous calls. Its result depends only on its input.
A related term is a side effect, which is a change a function makes outside its own result, such as updating a global variable or changing a file. Functional programming tries to avoid these where possible.
Statelessness helps distributed processing because the same task can be run on any machine. If a server fails, another server can repeat the task using the same input.
Higher-order functions
A higher-order function is a function that takes another function as an argument, returns a function, or both.
This is useful because Big Data tasks often apply the same operation to many records. For example, a higher-order function can apply a cleaning function to every record in a dataset, or combine many partial results.
Key Idea
Why functional programming helps distribution
Immutable data and stateless functions reduce hidden dependencies between machines. Higher-order functions make it easier to express “do this operation to every item” across many chunks of data.
Example
Combining word counts across servers
Two servers process short text records. Server A sees “cat dog cat”. Server B sees “dog bird”. The aim is to count each word.
-
Process each chunk independently: Server A produces counts for its own text: cat appears 2 times and dog appears 1 time. Server B produces counts for its own text: dog appears 1 time and bird appears 1 time.
-
Avoid shared mutable state: neither server updates a single shared dictionary while processing. Each returns its own result, so there is no conflict between machines.
-
Combine matching words: the partial counts are added: cat stays at 2, dog becomes 2, and bird stays at 1.
-
Explain the functional advantage: the work is easy to distribute because each chunk can be processed independently, and the combining step depends only on the returned values.
Tip
A quick way to link functional programming to Big Data
In an exam answer, connect each feature to distribution: immutable means no unexpected changes, stateless means tasks can run anywhere, and higher-order functions help apply the same operation across many data items.
Fact-based models
A fact-based model represents data as separate facts. Each fact captures one single piece of information.
Definition
Fact-based model
A fact-based model stores data as individual facts, where each fact records one piece of information about an entity, attribute or relationship.
For example, instead of forcing all information into one large table, the model might store facts such as:
- Customer C42 has age 34.
- Customer C42 lives in Location L9.
- Customer C42 placed Order O1001.
- Order O1001 contains Product P555.
- The quantity in that order-product relationship is 2.
This approach is useful for complex datasets because new kinds of facts can be added without redesigning one huge fixed table.
Graph schemas
A graph is a structure made of nodes and edges. In Big Data modelling, a graph schema can capture the structure of a dataset.
Definition
Graph schema
A graph schema describes the structure of data using nodes for things, edges for relationships, and properties for named values attached to nodes or edges.
A node represents an entity or object, such as a customer, product, location or order.
An edge represents a relationship between nodes, such as a customer placing an order or an order containing a product.
A property is a named value attached to a node or edge, such as age, timestamp, category or quantity.
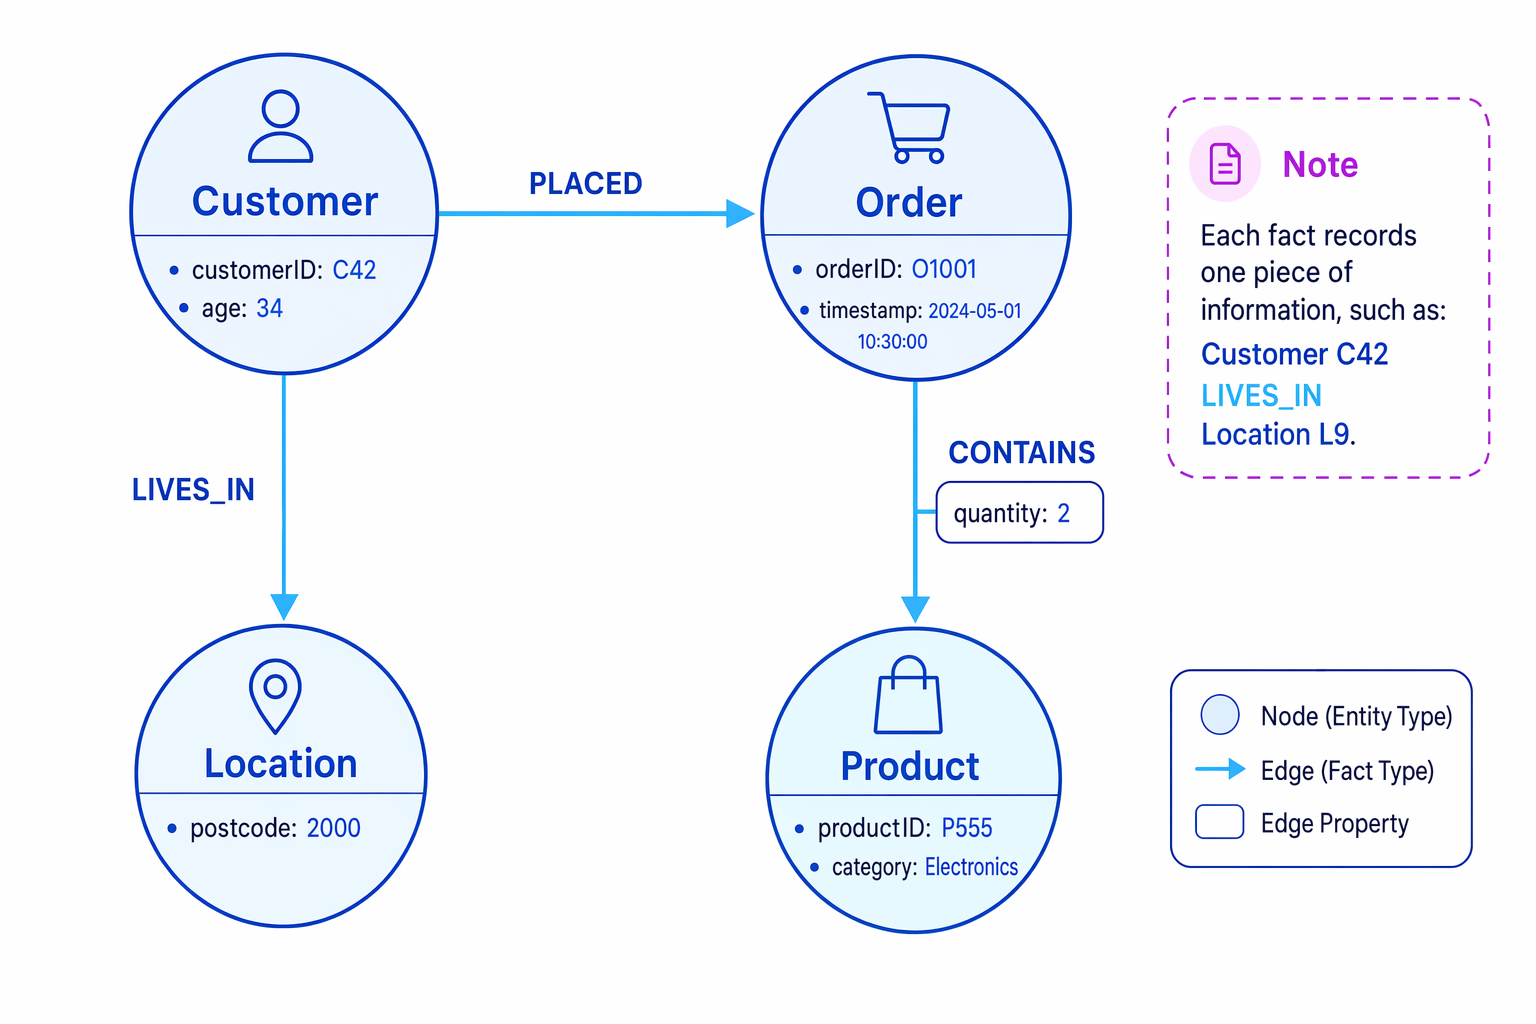
Graph schemas are useful when the important information is in the relationships between items, not just in individual rows.
Example
Building a graph schema from facts
A dataset says: Customer C42 is aged 34, lives in Location L9, placed Order O1001, and Order O1001 contains 2 of Product P555.
-
Identify the nodes: Customer, Location, Order and Product are the main things, so they become node types in the graph schema.
-
Identify the edges: “lives in” becomes an edge from Customer to Location, “placed” becomes an edge from Customer to Order, and “contains” becomes an edge from Order to Product.
-
Attach properties: age 34 is a property of the Customer node. The quantity 2 is a property of the contains edge, because it describes that relationship between the order and the product.
-
Check each fact is separate: each stored fact captures one piece of information, such as Customer C42 lives in Location L9 or Order O1001 contains Product P555.
Common Mistake
Confusing nodes and properties
Use nodes for important things that can have relationships, such as customers or products. Use properties for values that describe those things, such as age, timestamp or category.
Bringing the topic together
Big Data is about more than storing a large file. It is about designing systems that can cope with data that is too large, too fast-moving or too varied for ordinary single-server, table-based approaches.
The main ideas link together like this:
- Volume can force storage and processing across multiple servers.
- Velocity means streamed data may need a response within milliseconds to seconds.
- Variety makes analysis difficult because data may be unstructured.
- Machine learning helps find patterns in complex data.
- Functional programming helps write distributed code that is correct and efficient.
- Fact-based models and graph schemas help represent complex relationships in varied data.
Exam technique
In the exam
-
If asked to define Big Data, mention at least two of volume, velocity and variety, not just “large amounts of data”.
-
If asked why relational databases may be unsuitable, explain the row-and-column requirement and the difficulty of scaling across multiple machines.
-
If asked about functional programming, link features to benefits: immutable data supports correctness, statelessness supports distribution, and higher-order functions support applying operations across many records.
Self review
Check yourself
- Why is variety often a harder Big Data problem than volume?
- How does statelessness make distributed processing easier?
- In a graph schema, what is the difference between a node, an edge and a property?
You've reached the end
Test yourself on this topic, or move on to the next guide.
How was this guide?