Reading a mass spectrum
Reading a mass spectrum
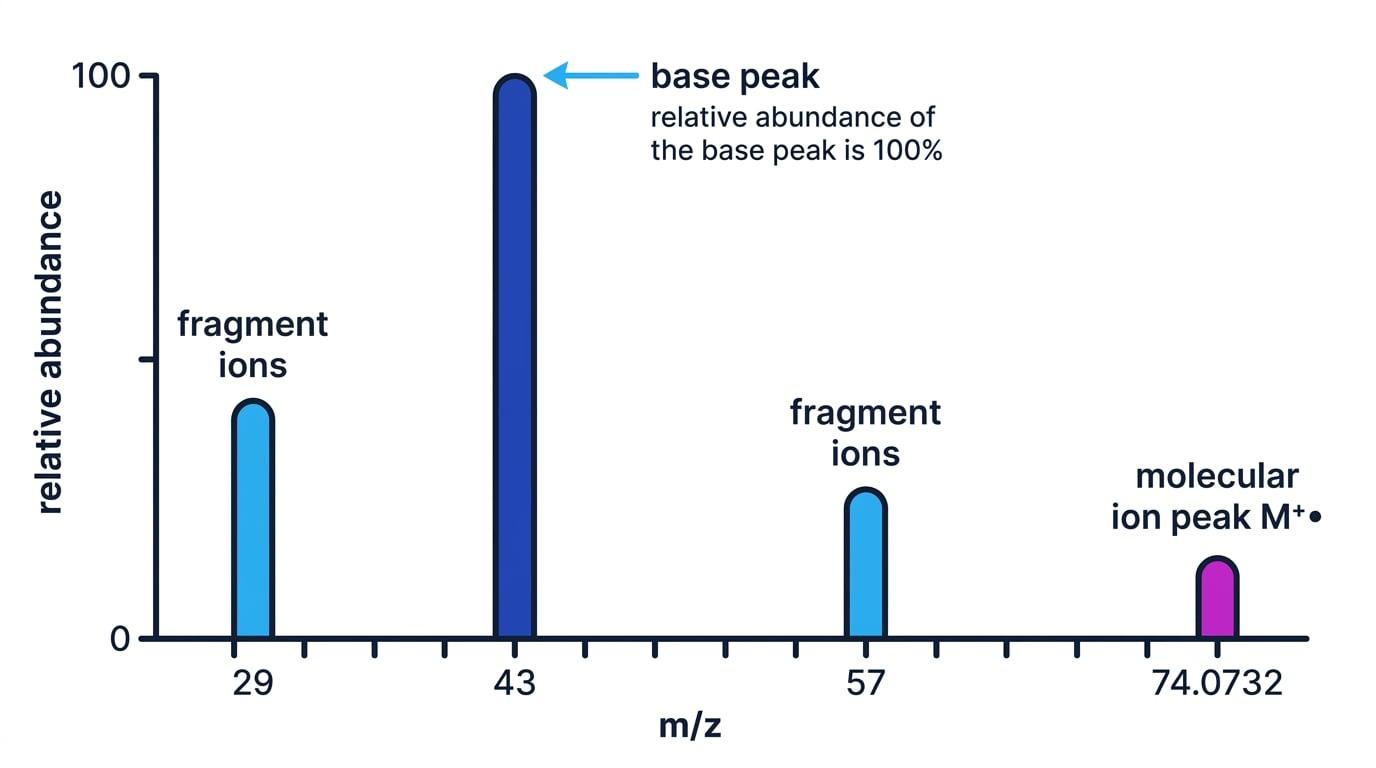
Mass spectrometry turns molecules into ions, separates them by mass-to-charge ratio, and plots a mass spectrum. The horizontal axis is m/zm/zm/z and the vertical axis is relative abundance.
Mass spectrometry Lesson
Step-by-step lessons on AQA A Level Chemistry Mass spectrometry. Each one builds up to exam-style questions. Build confidence with atomic structure, bonding and moles calculations early on, since these underpin the more demanding organic mechanisms, equilibrium and practical-analysis topics that dominate Year 2.