From data to decisions
From data to decisions
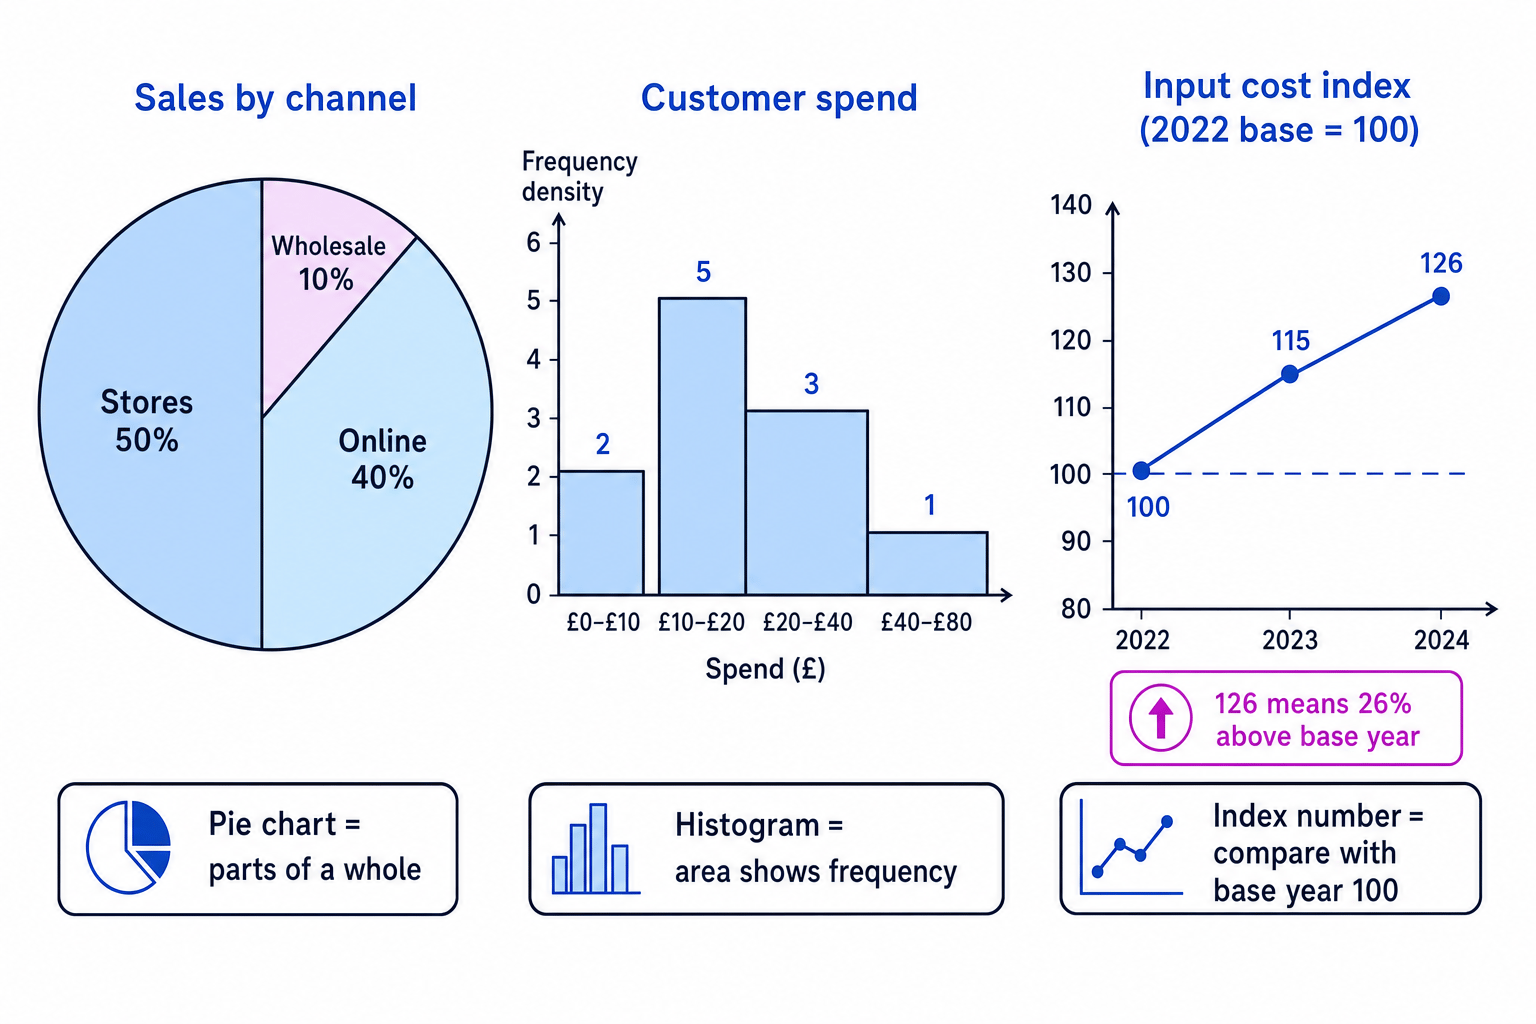
Data analysis turns raw facts into useful evidence for decisions. In business, strong answers do more than describe numbers: they present the data clearly, interpret what it shows, and analyse why it matters.
Data analysis Lesson
Step-by-step lessons on Eduqas A Level Business Data analysis. Each one builds up to exam-style questions. Build up your knowledge of the core business functions first, then focus revision time on the strategy and evaluation-heavy topics, since these carry the most marks.